


Oil Price Forecast
- WTI Crude oil prices re-tested the $40-handle this week.
- Just two months ago the current contract in Oil plunged well-below the zero-value; but since a strong recovery has shown with Oil prices gaining since early-May.
- Can Oil bulls pose another breakout? Given the two June tests at the $40 level combined with the build of an inverse head-and-shoulders pattern, bullish breakout potential may remain into next week’s trade.
Oil Prices Re-Test $40 Just Two Months After Going to -40
Things move fast in global markets, especially when we’re in the midst of a global pandemic.
It was now just about two months ago that Oil prices blew up and traded below the zero level on April 20th. While there was certainly a supply/demand issue playing a role ahead of the capitulation, it was a mess of a scenario that allowed for Oil prices to temporarily trade at negative values; and with storage facilities already largely full there wasn’t even much opportunity for arbitrage in buying those below-zero contracts, taking delivery and then selling that same oil in forward months.
Since then, however, the supply/demand picture has changed a bit. Oil prices have started to perk up again and this week, for the second time in the month of June, WTI tested the $40-handle on the chart; something that hadn’t happened since early-March, just before the coronavirus pandemic began to get priced-in to forward-looking projections.
WTI Crude Oil – Current Contract Month CL1 – Four-Hour Price Chart
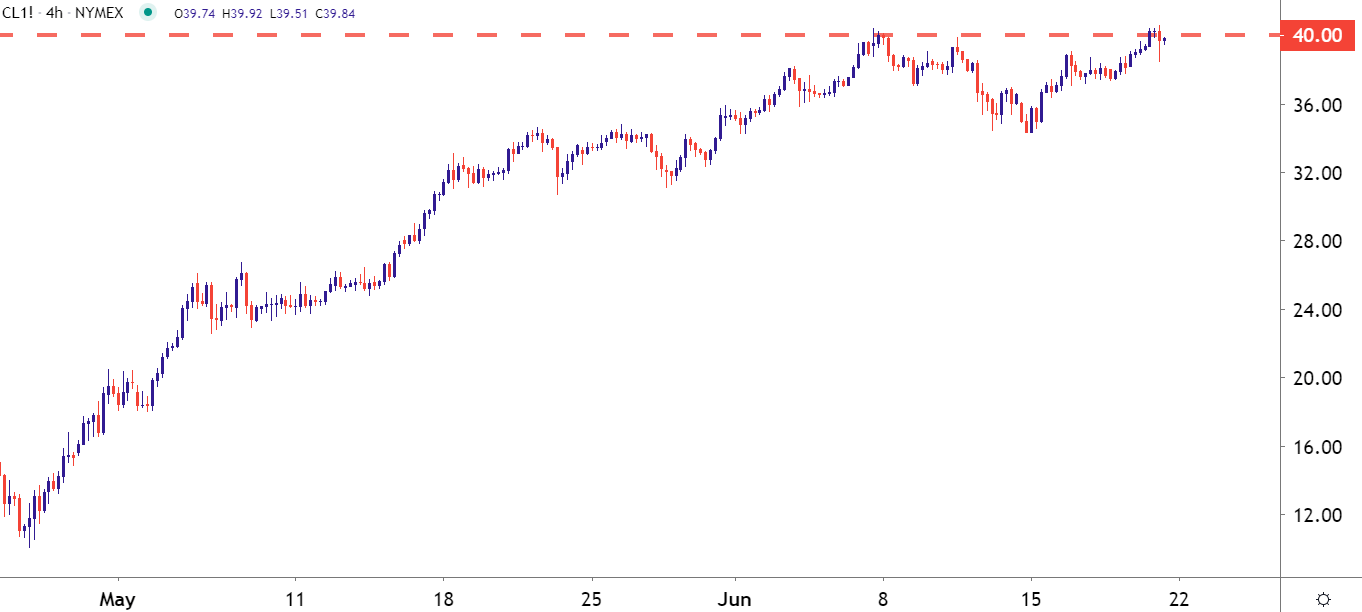
Chart prepared by James Stanley; CL1 on Tradingview
Longer-term analysis on the current contract in Oil futures is complicated by that late-April bearish run, when prices plunged below the zero-level. And that very significant dent on the chart is going to be evident in a number of related derivatives, including CFDs that offset into those markets. But – one mannerism of analysis that may offer that bigger-picture look is by focusing on the next contract month, as this did not plunge below the zero value during April. This pains a less bullish picture as the almost two-month-bounce has yet to completely fill the gap from early-March.
So, while the strength since early-May is evident in both venues, incorporation of that prior gap combined with a Fibonacci retracement drawn on that major move highlights a point of emphasis around the $41.34 level, which is the 50% marker of the 2020 major move as well as being the top-end of that prior gap.
WTI Crude Oil – Next Contract Month CL2 – Daily Price Chart

Chart prepared by James Stanley; CL2 on Tradingview
Short-Term Breakout Potential, Long-Term Resistance
Taking a shorter-term look at the matter ahead of next week’s open, and there is bullish potential with breakout possibilities above the $40-handle. Given the multiple tests of that level, combined with the build of an inverse head-and-shoulders pattern, and buyers may eventually be able to break-through to the other side. The big question is for how long that drive may last, as just beyond is a potential point of resistance around the 41.34 level; so gains may be capped after a strong run breaks out to a new high and then quickly tests another level of resistance.

Given the build of the formation combined with breakout potential, the technical forecast will be set to bullish for the week ahead.
Technical Forecast for Oil: Bullish
WTI Crude Oil – Next Contract Month CL2 – Four-Hour Price Chart

Chart prepared by James Stanley; CL2 on Tradingview
--- Written by James Stanley, Strategist for DailyFX.com
Contact and follow James on Twitter: @JStanleyFX


