Dow Jones, Nasdaq 100, DAX 30 Price Outlooks:
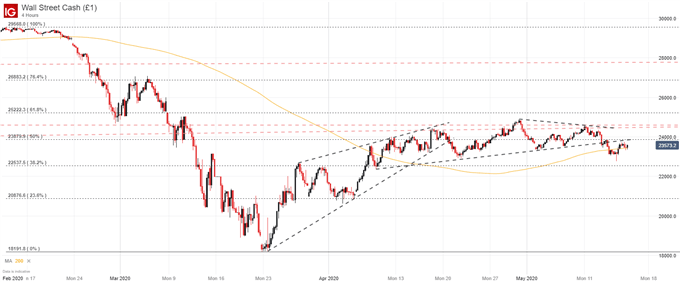
- In the event of a recovery, the Dow Jones will have to surmount resistance around the 24,000 mark
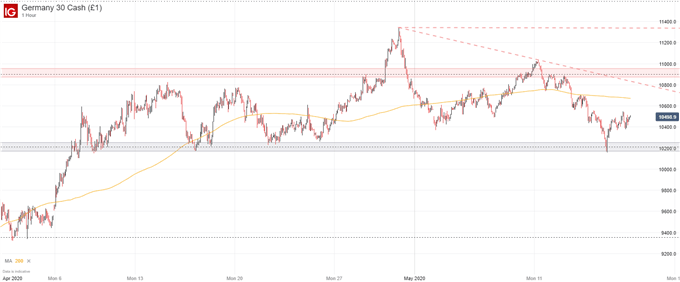
- The DAX 30 stands maintains a neutral outlook for the time being, but a break beneath support could change that
- Find out what type of trading style suits you best.
Dow Jones Technical Forecast
Outlook: Bearish
The Dow Jones continued to lag the Nasdaq 100 and S&P 500 last week as it grapples with technical levels far beneath that of the other two indices. Nevertheless, the barriers have shown their ability to influence price in the past which is an encouraging sign if bears make an attempt lower. With sentiment seemingly hanging in the balance, here are the technical levels to watch next week.
Dow Jones Price Chart: 4 – Hour Time Frame (February – May)

As evidenced in the slope of recent price action, the Dow Jones has slowed its ascent and even suffered a lower low last week. Together with resistance around the 24,000 mark, price action could suggest the Dow has become susceptible to further weakness in the week ahead which could see the Industrial Average explore possible support around 22,537. The level influenced price a few times in late March and early April, and could provide buoyancy yet again if bearishness continues. Recent changes in client sentiment could also hint at further Dow losses.
Nasdaq 100 Technical Forecast
Outlook: Neutral
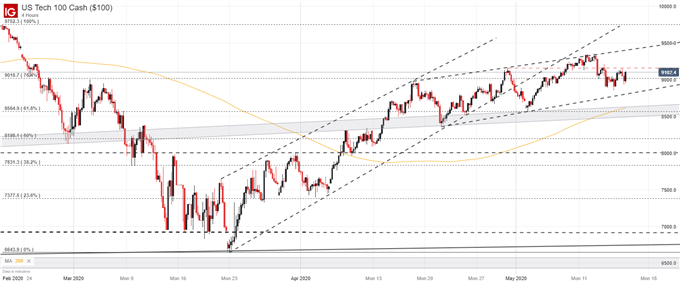
The Nasdaq 100, by comparison, has been a pillar of strength in the equity space. Surging higher and faster than the other indices, the Nasdaq has reclaimed most of the ground it lost in the initial coronavirus crash and trades just 12% below all-time highs. In turn, the tech-heavy index has not established a new low which may allow prior swing lows to provide some assistance if bearishness continues. Regardless, the slope of the Nasdaq’s price action speaks to its relative strength and the various channel boundaries beneath, around 8,830 and 8,640, will look to ward off steeper declines.
Nasdaq 100 Price Chart: 4 – Hour Time Frame (February – May)

DAX 30 Technical Forecast
Outlook: Neutral
Unlike the Dow Jones and Nasdaq, the DAX 30 has few supportive trendlines to work with. Apart from the Fibonacci level around 10,200, nearby support is relatively sparse which could see the German equity index accelerate lower if the initial level is breached. Thus, a break beneath could open the door to further losses.
DAX 30 Price Chart: 1 – Hour Time Frame (April – May)

On the other hand, recent price moves have highlighted the influence of the Fibonacci level overhead around 10,900 which may look to resist a rebound if the descending trendline projection around 10,800 fails. That being said, the DAX 30 did not post a fresh low like the Dow Jones, so the technical outlook has not shifted fully negative in my view, but remains neutral at best.
--Written by Peter Hanks, Analyst for DailyFX.com


