Gold Price Highlights:
- Gold finally coming out of a bullish technical formation
- The wedge is poised to lead it to 2011/12 levels
Gold finally coming out of a bullish technical formation
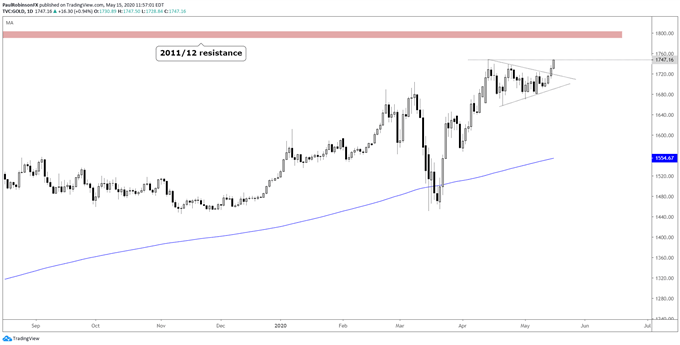
The price of gold has been generally moving sideways with price converging recently. The convergence has led to the development of a wedge formation that is giving way to a rise in prices. The long-term trend has been up for a while and the near-term trend has been steady since bottoming in March.
The pattern plus trend combination is a powerful one for higher levels in the days/weeks ahead. The only caveat to the breakout is that not long after a rise to new multi-year highs, a through test of resistance could be in order and will have big implications on how things progress from there.
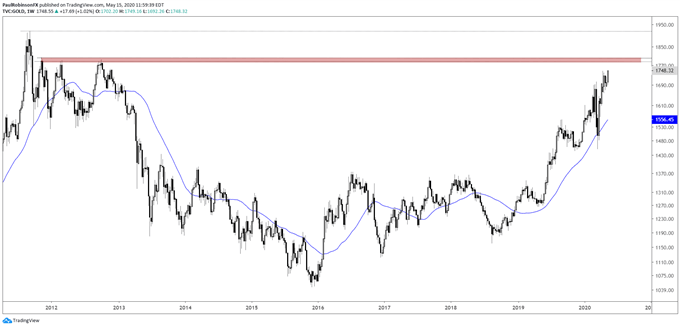
During the topping process in 2011/12 there were three peaks created around 1800 (~1790/1802) in the cash market. This could be a formidable test that has potential to dent the rally with an intermediate-term correction. But if it doesn’t then the 2011 record high at 1920 could come quickly.
This means traders will need to be geared up and ready to go next week, as potential for a big move quickly rises. To dent the current short-term advance a move back through the other side of the wedge would be needed, a move taking price under 1680. Also keep an eye on silver as it is trying to play catch-up with gold. The gold/silver ratio may have capitulated in Q1 and start to highlight silver performance over gold.


Gold Daily Chart (wedge breakout)

Gold Weekly Chart (2011/12 resistance)

Resources for Forex Traders
Whether you are a new or experienced trader, we have several resources available to help you; indicator for tracking trader sentiment, quarterly trading forecasts, analytical and educational webinars held daily, trading guides to help you improve trading performance, and one specifically for those who are new to forex.
---Written by Paul Robinson, Market Analyst
You can follow Paul on Twitter at @PaulRobinsonFX


