


US Dollar, EUR/USD, GBP/USD, USD/CAD, USD/JPY Technical Forecast
- The US Dollar put in an extremely volatile month of March with an 8.8% ramp in roughly ten days.
- The US Dollar has since started to coil; but the long-legged doji on the monthly chart highlights the potential for continued extreme volatility.
- Below, USD scenarios are plotted via major currency pairs of EUR/USD, GBP/USD, USD/CAD, and USD/JPY.
US Dollar Coils After a Riveting Month of March
It’s been a very volatile past few weeks in the US Dollar, marked by a huge spike in mid-March that continues to define the currency’s tone today. After pushing down to a fresh yearly low in the early part of last month, an 8.8% rally in the USD brought into play a fresh three-year-high. Since then, however, price action has settled towards that middle of that prior range: And another stimulus announcement out of the Federal Reserve helped to push sellers on the offer heading into Good Friday.
At this point, it’s the longer-term chart in the US Dollar that remains of such interest, as last month’s long-legged doji printed near a key zone of confluent resistance on the chart. And this, combined with a plethora of stimulus tools that have already been enacted by the Fed and Treasury Department may help to keep that resistance defended, at least in the near-term. But, as is usual around the US Dollar, the framework of prognosis is often defined by the currency it’s being paired up with, and as such, I look at four different major currency pairs below.
US Dollar Monthly Price Chart

Chart prepared by James Stanley; USD, DXY on Tradingview
EUR/USD Vulnerable to USD-Strength
The Euro zone has been in a tough spot, economically speaking, for some time now. And the ECB tried to help by keeping cheap money policies as the boilerplate strategy for years. It was almost eight years ago that Mario Draghi had his ‘whatever it takes moment.’ And Jerome Powell had a few of those last month. But for newly appointed head of the European Central Bank, Christine Lagarde, the question has to be asked when she’ll have her own.
| Change in | Longs | Shorts | OI |
| Daily | -1% | -4% | -3% |
| Weekly | 4% | -10% | -5% |
In EUR/USD, last month’s aggressive volatility also printed a long-legged doji, albeit with a smaller relative range than what was seen above in the US Dollar via DXY. The technical forecast for EUR/USD will be set to bearish for the week ahead.
EUR/USD Monthly Price Chart
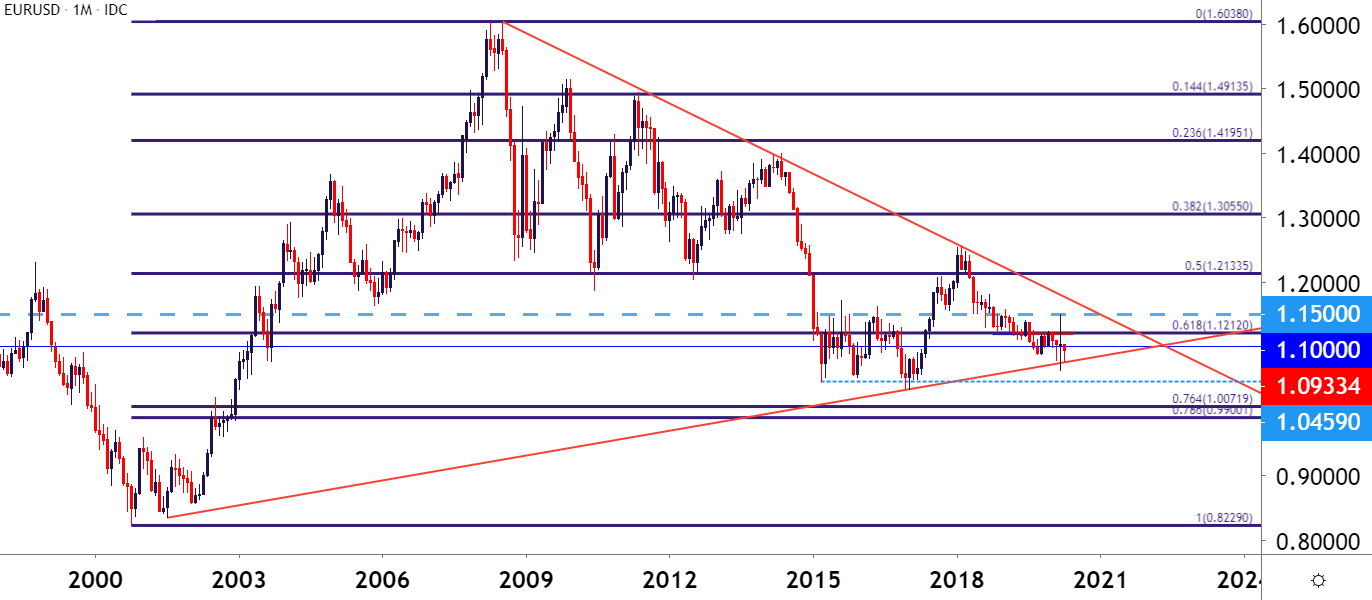
Chart prepared by James Stanley; EURUSD on Tradingview
GBP/USD Claws Back March Losses
Last month saw a precipitous decline in GBP/USD spot rates as Cable broke down to fresh 35-year lows. Support eventually showed just below the 1.1500 handle but, peak to trough, this amounted to a 2,000+ pip move from the December high.
| Change in | Longs | Shorts | OI |
| Daily | 3% | -7% | -3% |
| Weekly | 4% | -10% | -5% |
The final month of March, however, brought sizable pullback into the mix, and GBP/USD has already clawed back more than 50% of that prior sell-off. Resistance has continued to show at the half-way marker of that prior major move, and this can keep the door open for bearish reversal scenarios, particularly for those looking for ways to take on long-USD exposure. The technical forecast for GBP/USD next week will be set to bearish.
GBP/USD Weekly Price Chart
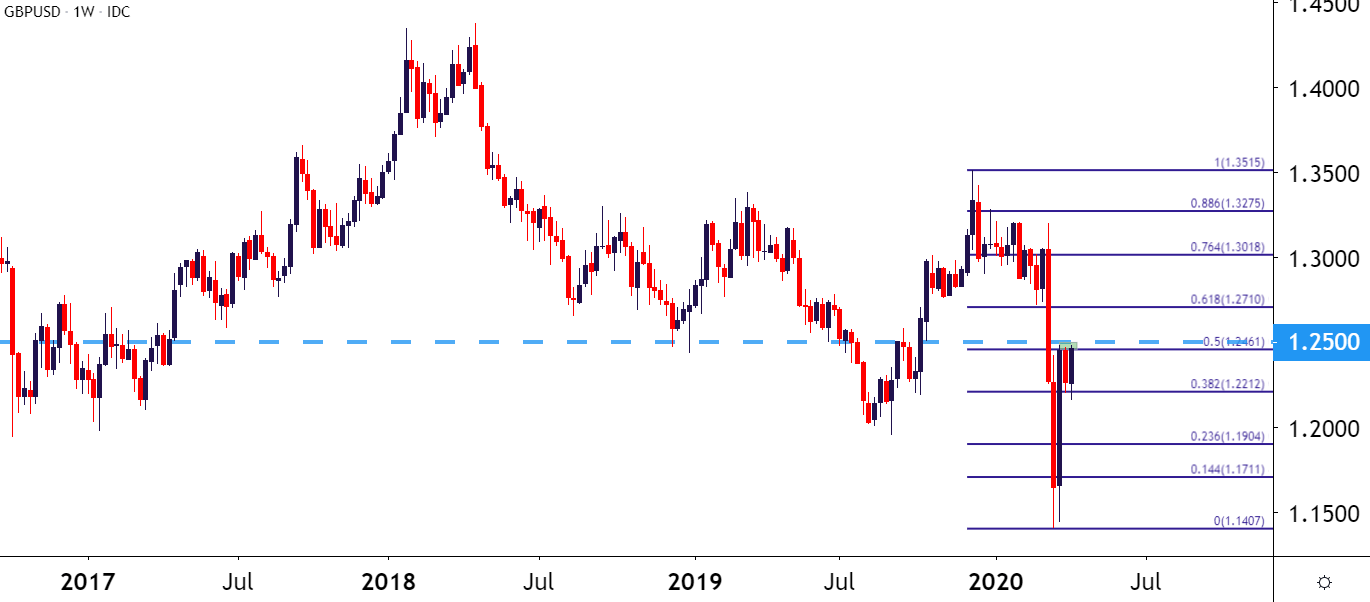
Chart prepared by James Stanley; GBPUSD on Tradingview
USD/CAD Goes for a Wild Ride
The USD/CAD pair has been especially volatile of recent as not only have risk aversion themes hit the pair, but volatility in oil prices has played a big role in the movement around USD/CAD of recent. I had looked into the matter in more depth in the article, Canadian Dollar Price Outlook: Loonie Drop, USD/CAD Pop to 1.4000 Test. I had also looked into the pair in my Thursday webinar, looking at potential USD-weakness strategies as a descending triangle had started to build on shorter-term charts. Horizontal support is being offered around the 14.4% retracement of the 2011-2016 major move, and lower-highs open the door for a deeper bearish push before the longer-term bullish trend may come back into favor. The technical forecast for next week will be set to bearish for USD/CAD.
| Change in | Longs | Shorts | OI |
| Daily | -2% | 7% | 5% |
| Weekly | -30% | 38% | 13% |
USD/CAD Eight-Hour Price Chart

Chart prepared by James Stanley; USDCAD on Tradingview
USD/JPY Longer-Term Bearish Potential
The recent theme of USD-weakness is an encouraging one for the risk trade; highlighting how markets are getting a bit more comfortable with risk exposure after a frightful move to cash in the month of March. In USD/JPY, that carry may no longer be as attractive given the precipitous fall in US rates; and there could be ample motive for a continuation of Yen-strength as longer-term carry scenarios further unwind.
| Change in | Longs | Shorts | OI |
| Daily | -2% | 2% | 0% |
| Weekly | 12% | -16% | -6% |
From the monthly chart, there’s a form of a descending triangle that’s shown, although it’s not exactly a ‘clean’ setup. Support shows around the 50% marker of the 2012-2015 major move, with an assist from the 101.19 level that came in as the swing-low on the night of the 2016 election and again last month. Resistance is taken from a descending trendline that’s largely remained in-order, with the notable exception of last two months’ wild topside wicks. The technical forecast for USD/JPY will be set to bearish for next week.
USD/JPY Monthly Price Chart
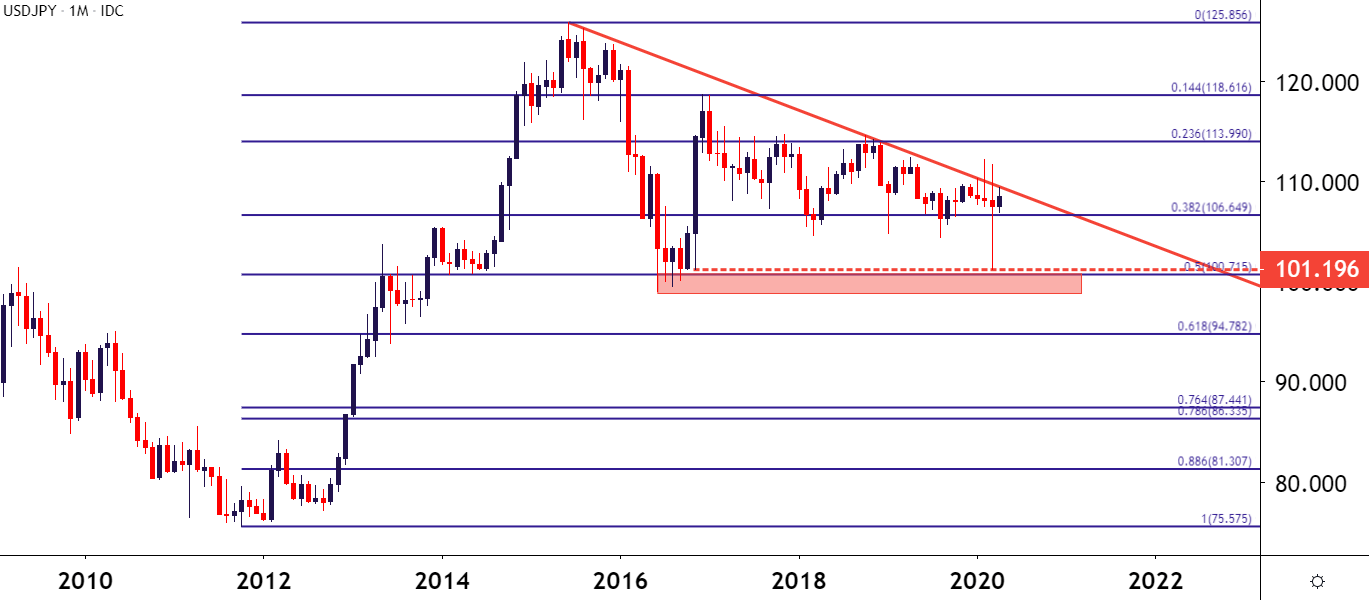
Chart prepared by James Stanley; USDJPY on Tradingview
--- Written by James Stanley, Strategist for DailyFX.com
Contact and follow James on Twitter: @JStanleyFX


