


British Pound, GBP/USD, EUR/GBP, GBP/JPY, GBP/AUD - Technical Forecast
- GBP/USD eyes rising support from last month’s bottom
- EUR/GBP watching falling resistance from March’s top
- GBP/JPY momentum fading, GBP/AUD uptrend in focus
GBP/USD Technical Outlook
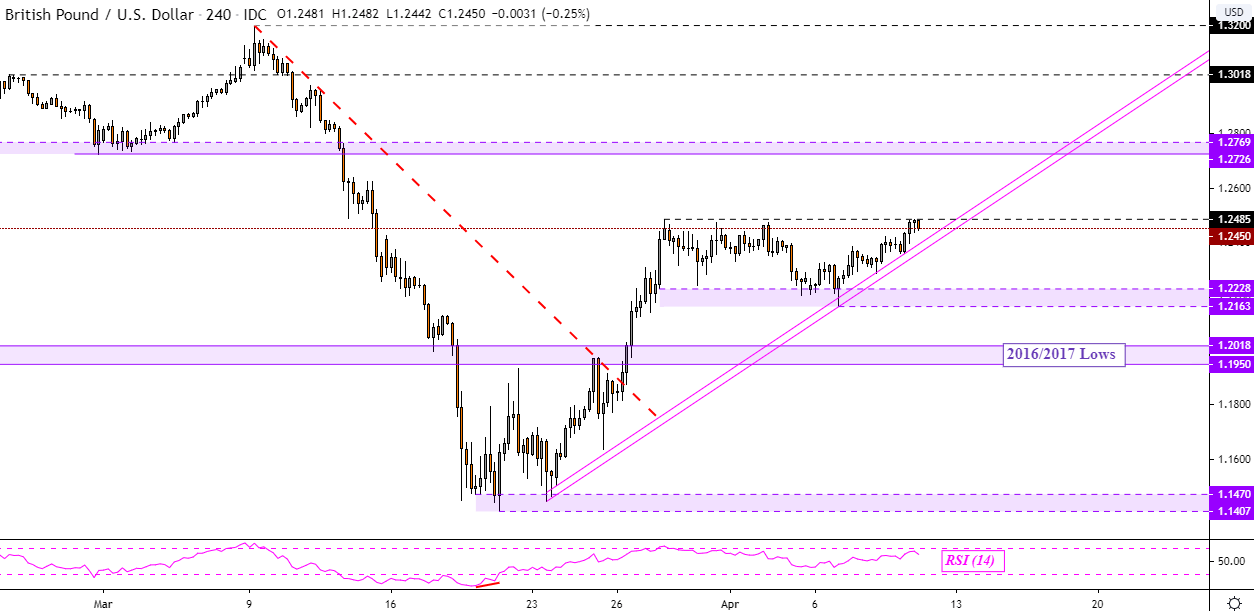
The British Pound may continue adhering to rising support as it makes cautious upside progress against the US Dollar in the week ahead. If GBP/USD pushes above 1.2485 on the 4-hour chart below, that exposes former lows from early March which could make for a barrier of resistance between 1.2726 to 1.2769. Otherwise a turn lower places the focus on 1.2163 as investors weigh the possibility of a reversal. During these volatile times in financial markets, confirming technical breakouts is arguably of utmost importance.
| Change in | Longs | Shorts | OI |
| Daily | 3% | -7% | -3% |
| Weekly | 4% | -10% | -5% |
GBP/USD Daily Chart
EUR/GBP Technical Outlook
EUR/GBP may be guided lower buy key falling resistance from last month’s top at 0.9498 – blue line on the 4-hour chart below. A push above the trend line exposes 0.8744 which if taken out, may pave the way to revisit highs from October. Otherwise resuming the downtrend could see the Euro revisit it weakest against the British Pound since early March. Positive RSI divergence does show fading downside momentum which can precede a turn higher.
Forupdates on the British Pound this week, including on the election, follow me on twitter here @ddubrovskyFX.
EUR/GBP 4-Hour Chart

GBP/JPY Technical Outlook
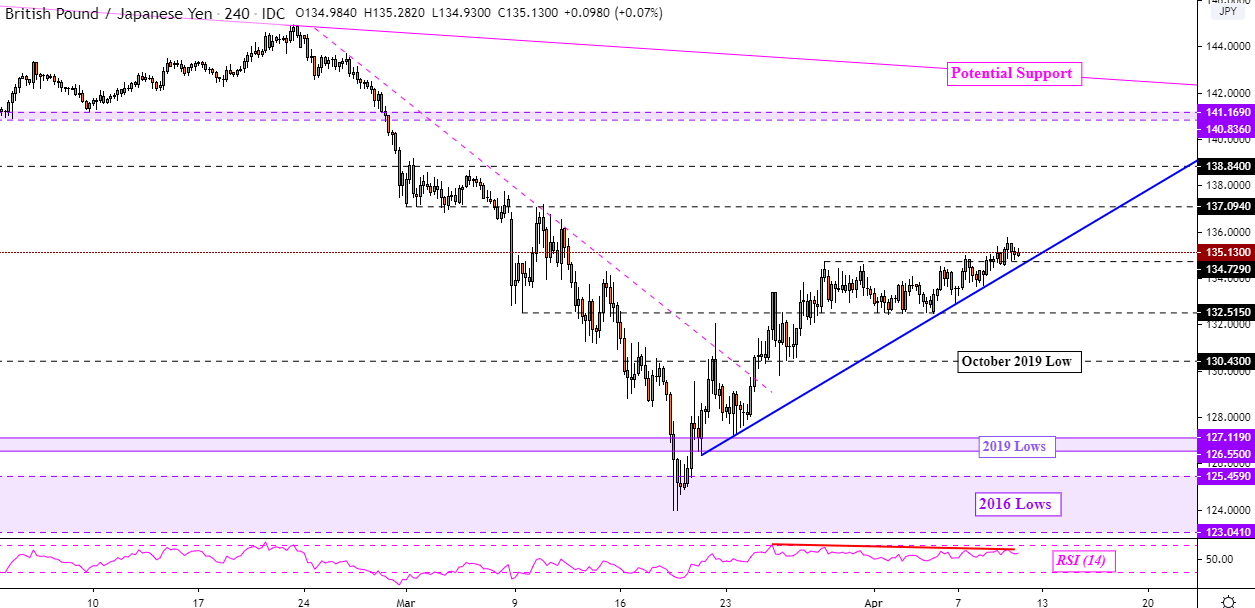
Rising support will be in focus for GBP/JPY during the week ahead – blue line on the 4-hour chart below. Negative RSI divergence has been persisting which shows fading upside momentum. A turn lower exposes 132.51 followed by former lows from October 2019. Otherwise uptrend resumption places the focus on immediate resistance at 137.09 followed by 138.84.
| Change in | Longs | Shorts | OI |
| Daily | 1% | -3% | -1% |
| Weekly | 13% | -31% | -17% |
GBP/JPY 4-Hour Chart
GBP/AUDTechnical Outlook
GBP/AUD turned lower after a Spinning Top formed on the daily chart alongside negative RSI divergence – as expected. The dominant uptrend is being maintained by “outer support” on the daily chart from August. Closing under the trend line exposes the March low at 1.9291 which if taken out, opens the door to a material dovish technical shift. Otherwise resuming gains may see prices retest the 14.6% minor Fibonacci extension at 2.0004 followed by the 23.6% level at 2.030 towards last month’s top.
GBP/AUD Daily Chart

--- Written by Daniel Dubrovsky, Currency Analyst for DailyFX.com
To contact Daniel, use the comments section below or @ddubrovskyFX on Twitter


