


Japanese Yen, USD/JPY, EUR/JPY, GBP/JPY, CAD/JPY - Talking Points
- Japanese Yen saw mixed week as the currency transitioned into consolidation
- USD/JPY declines came to a pause as support held, EUR/JPY eyes 2019 lows
- GBP/JPY at risk to losses amid Rising Wedge, CAD/JPY may trade sideways
USD/JPY Outlook
The Japanese Yen consolidated against the US Dollar last week. This was after USD/JPY pushed above a short-term falling trend line from March 25 on the 4-hour chart below. The upper bound is a barrier between 108.48 to 108.72. The lower bound sits between 106.89 to 107.10. Guiding the pair higher may be “potential” support from last month’s bottom. A third confirmation test of the trend line may validate it. Pushing through the upper bound may see the pair revisit highs from 2019 while a turn lower exposes last year’s trough.
| Change in | Longs | Shorts | OI |
| Daily | -2% | 2% | 0% |
| Weekly | 12% | -16% | -6% |
USD/JPY 4-Hour Chart
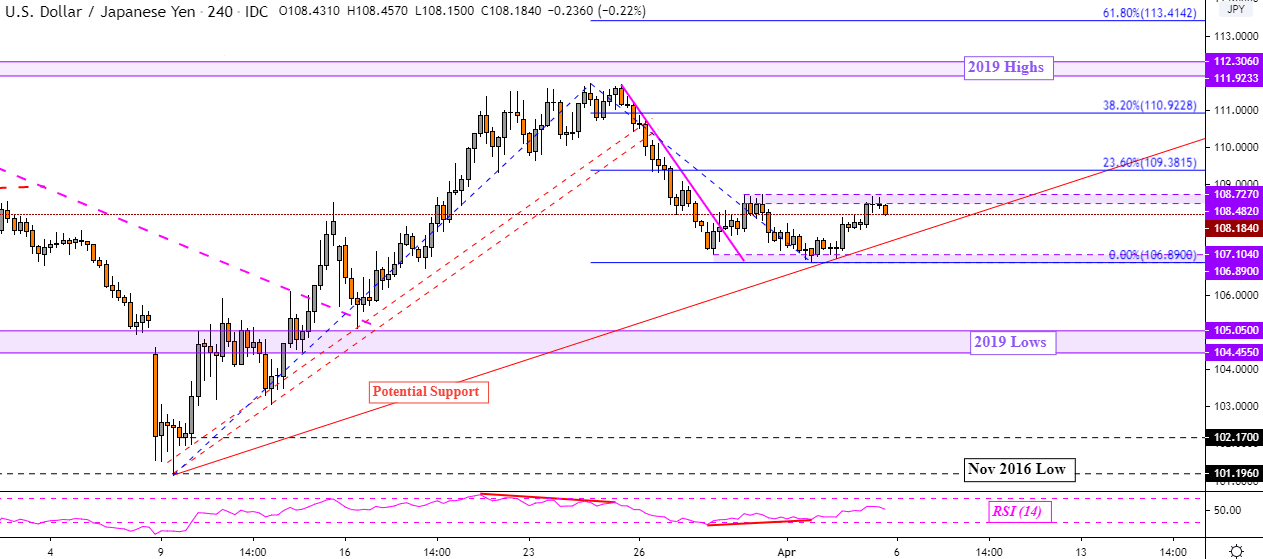
USD/JPY Chart Created in TradingView
EUR/JPY Outlook
The Euro traded cautiously lower against the Japanese Yen, albeit very choppily. Volatility has made its presence known in EUR/JPY since the outbreak of the coronavirus, sometimes resulting in wild swings over short periods of time over the past 2 months. For the time being, the pair seems to be in a downtrend since topping in late March. Prices are fast approaching 2019 lows after closing under rising support from early last month – red lines below. A descent through 115.86 exposes lows from 2017 and 2016. A push above 117.68 exposes 118.43. Higher-than-usual levels of volatility make confirming breakouts of utmost importance.
| Change in | Longs | Shorts | OI |
| Daily | -9% | 0% | -3% |
| Weekly | 17% | -22% | -11% |
EUR/JPY4-Hour Chart
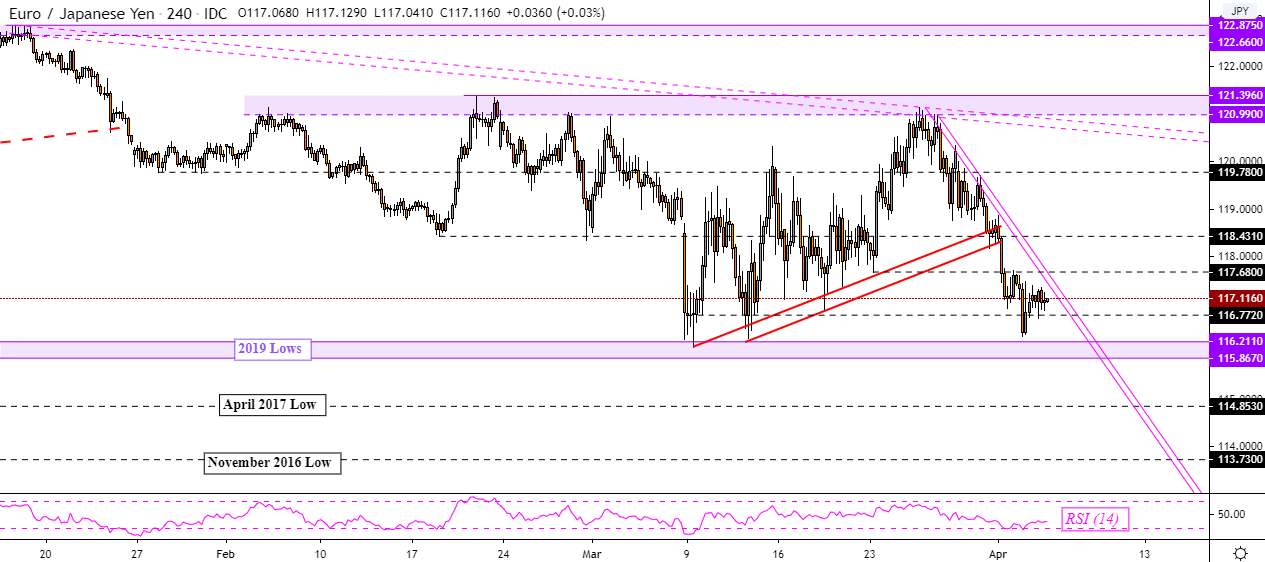
EUR/JPY Chart Created in TradingView
GBP/JPY Outlook
The British Pound could be at risk to the Japanese Yen ahead. This is because GBP/JPY could confirm a downside breakout through a Rising Wedge candlestick formation. This is a bearish chart pattern that could resume the dominant downtrend that preceded its formation. A close under 132.51 exposes 130.43 on the way back to lows from 2019 before revisiting the trough in 2016. Otherwise a push above 134.72 may invalidate the Rising Wedge and expose 137.09 followed by 138.87.
| Change in | Longs | Shorts | OI |
| Daily | 1% | -3% | -1% |
| Weekly | 13% | -31% | -17% |
GBP/JPY4-Hour Chart
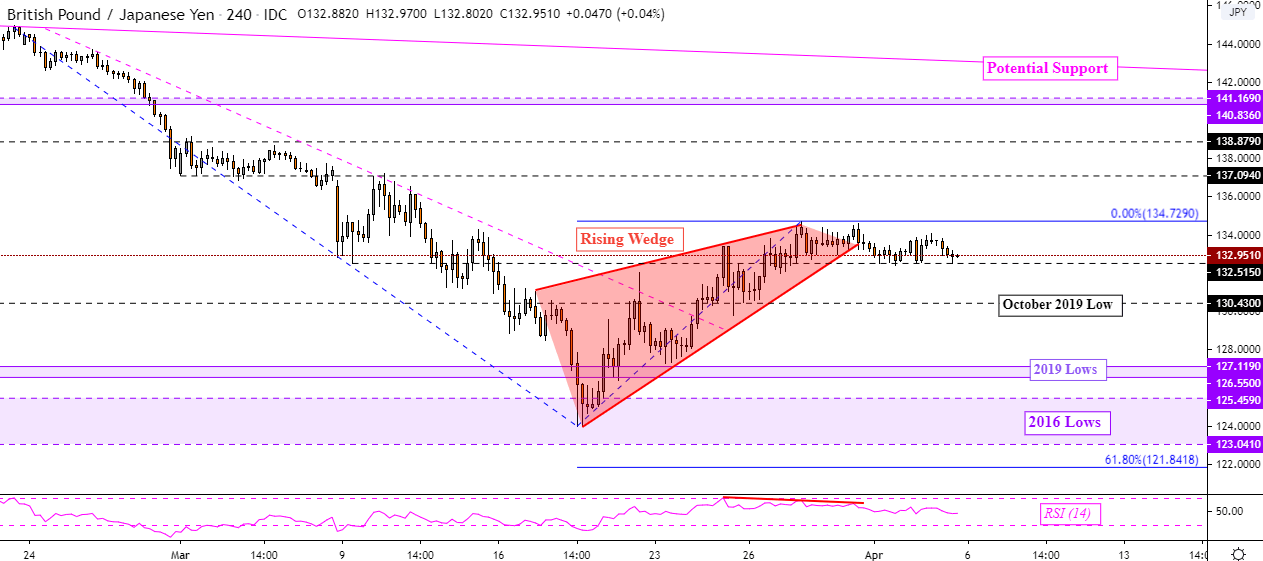
GBP/JPY Chart Created in TradingView
CAD/JPY Outlook
Volatility in crude oil prices this past week boosted the commodity, fueling the Canadian Dollar against the Japanese Yen. Yet CAD/JPY appeared to struggle to push above near-term falling resistance from late March – pink line below. Broadly speaking, CAD/JPY has been in a consolidation mode since prices found a bottom last month between 73.76 to 74.32. The upper bound of consolidation seems to sit around 78.51. This means that the pair may not see defining trends last in the medium term until it exits this congestive range.

CAD/JPY4-Hour Chart

CAD/JPY Chart Created in TradingView
--- Written by Daniel Dubrovsky, Currency Analyst for DailyFX.com
To contact Daniel, use the comments section below or @ddubrovskyFX on Twitter


