


DAX 30 & FTSE 100 Analysis and News
- US Labour Market to Deteriorate Significantly
- DAX | Upside Capped, Risks Tilted to the Downside
- FTSE 100 | Vulnerable to Further Losses
Equity markets resumed its bearish trend after month and quarter portfolio rebalancing flows waned, confirming what had been a bear market rally. The economic backdrop remains very weak and will continue to do so amid the continued spread of the coronavirus and the subsequent lockdown procedures. The latest jobs report showed what is just the tip of the iceberg in terms of a contraction in job growth (figure 1). As we look towards next week, the focus early in the week will be on the oil market with the possibility of a globally coordinated oil production cut. OPEC + emergency meeting scheduled for April 6th.
Figure 1. US Labour Market to Deteriorate Significantly

DAX | Upside Capped, Risks Tilted to the Downside
The DAX ended the week with marginal losses of 1% with equity markets trading in somewhat calmer fashion compared to recent weeks. Upside in the DAX had been capped at 9940, which marks the 38.2% Fibonacci retracement, alongside the rising trendline from the 2008. As such, we look to this level as a pivotal point for the DAX, with a closing break potentially offering room for a test of 10,200. That said, in light of the current macro backdrop we continue to expect that risks will remain tilted on the downside with a retest of support at 8740 eyed.
| Change in | Longs | Shorts | OI |
| Daily | -9% | 7% | 2% |
| Weekly | -27% | 9% | -5% |
DAX 30 Price Chart: Weekly Time Frame

Source: IG
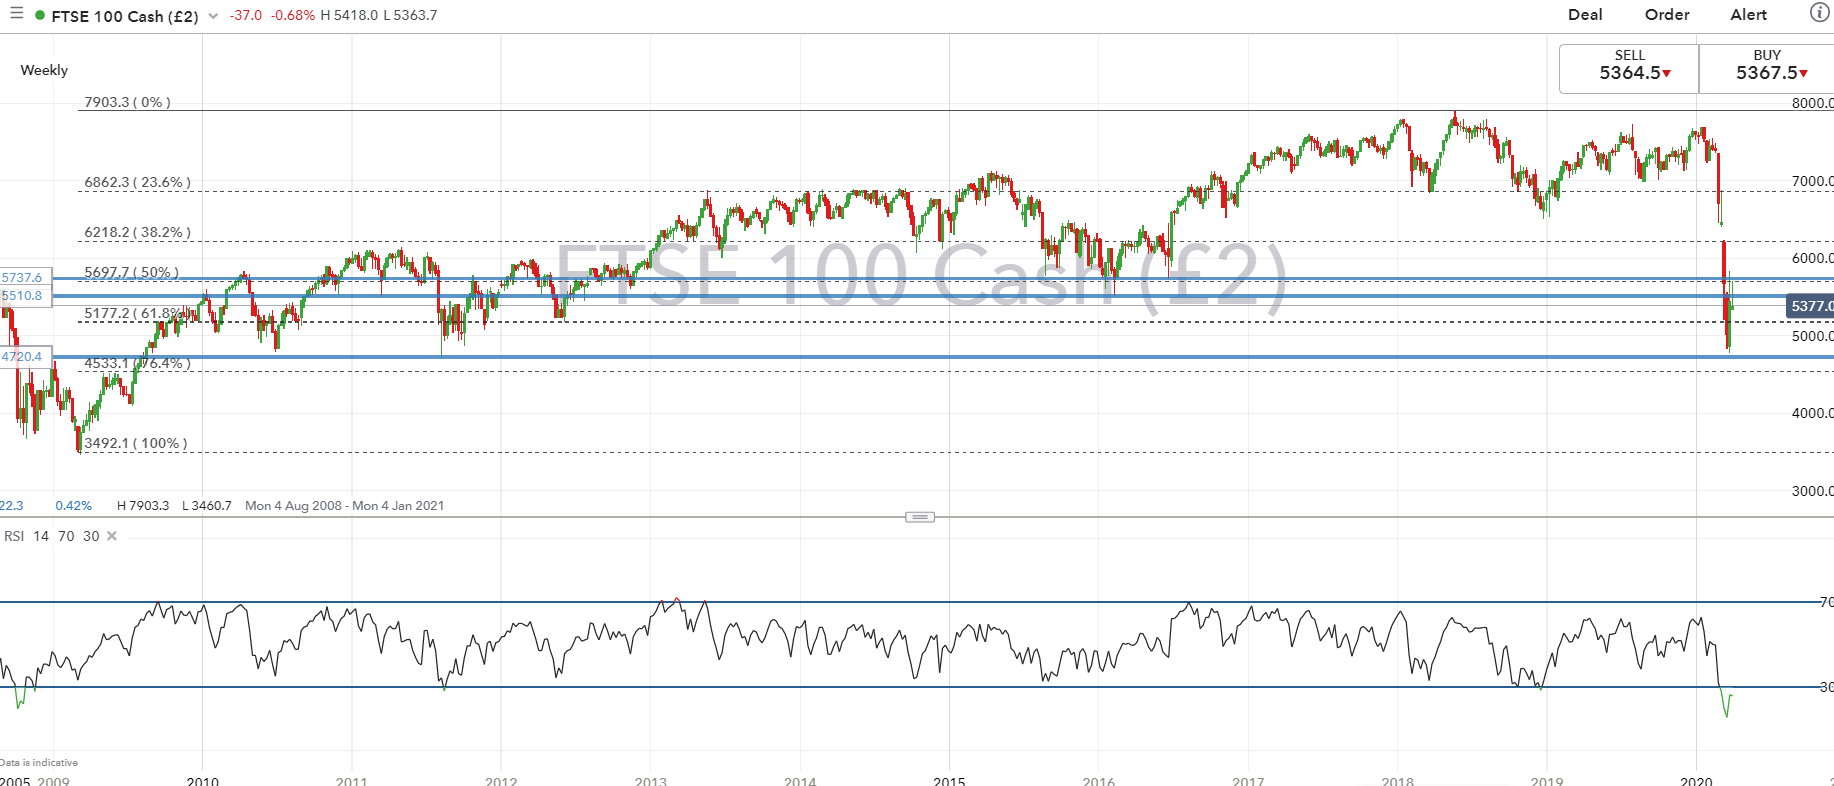
FTSE 100 | Vulnerable to Further Losses
Lacking notable upward momentum in the FTSE 100 stalls having failed to break above the 2016 lows. Consequently, the FTSE 100 remains at risk of a test of the 61.8% Fibonacci retracement with a closing break below opening room for a move towards the psychological 5000 level.
| Change in | Longs | Shorts | OI |
| Daily | -30% | 25% | 2% |
| Weekly | -44% | 44% | 0% |
Source: IG
RESOURCES FOR TRADERS
Whether you are a new or experienced trader, we have several resources available to help you; indicator for tracking trader sentiment, quarterly trading forecasts, analytical and educational webinars held daily, trading guides to help you improve trading performance, and one specifically for those who are new to forex.
--- Written by Justin McQueen, Market Analyst
Follow Justin on Twitter @JMcQueenFX


