


NZ Dollar Talking Points:
- The Kiwi has shifted from a range of fundamental and technical aspects across several crosses in recent weeks
- The EUR/NZD cross approaches key technical levels as the Kiwi struggles against the Euro
- DailyFX Forecasts are published on a variety of markets such as Gold, the US Dollar or the Euro and are available from the DailyFX Trading Guides page. If you’re looking to improve your trading approach, check out Traits of Successful Traders. And if you’re looking for an introductory primer to the Forex market, check out our New to FX Guide
NZD/CAD Technical Outlook
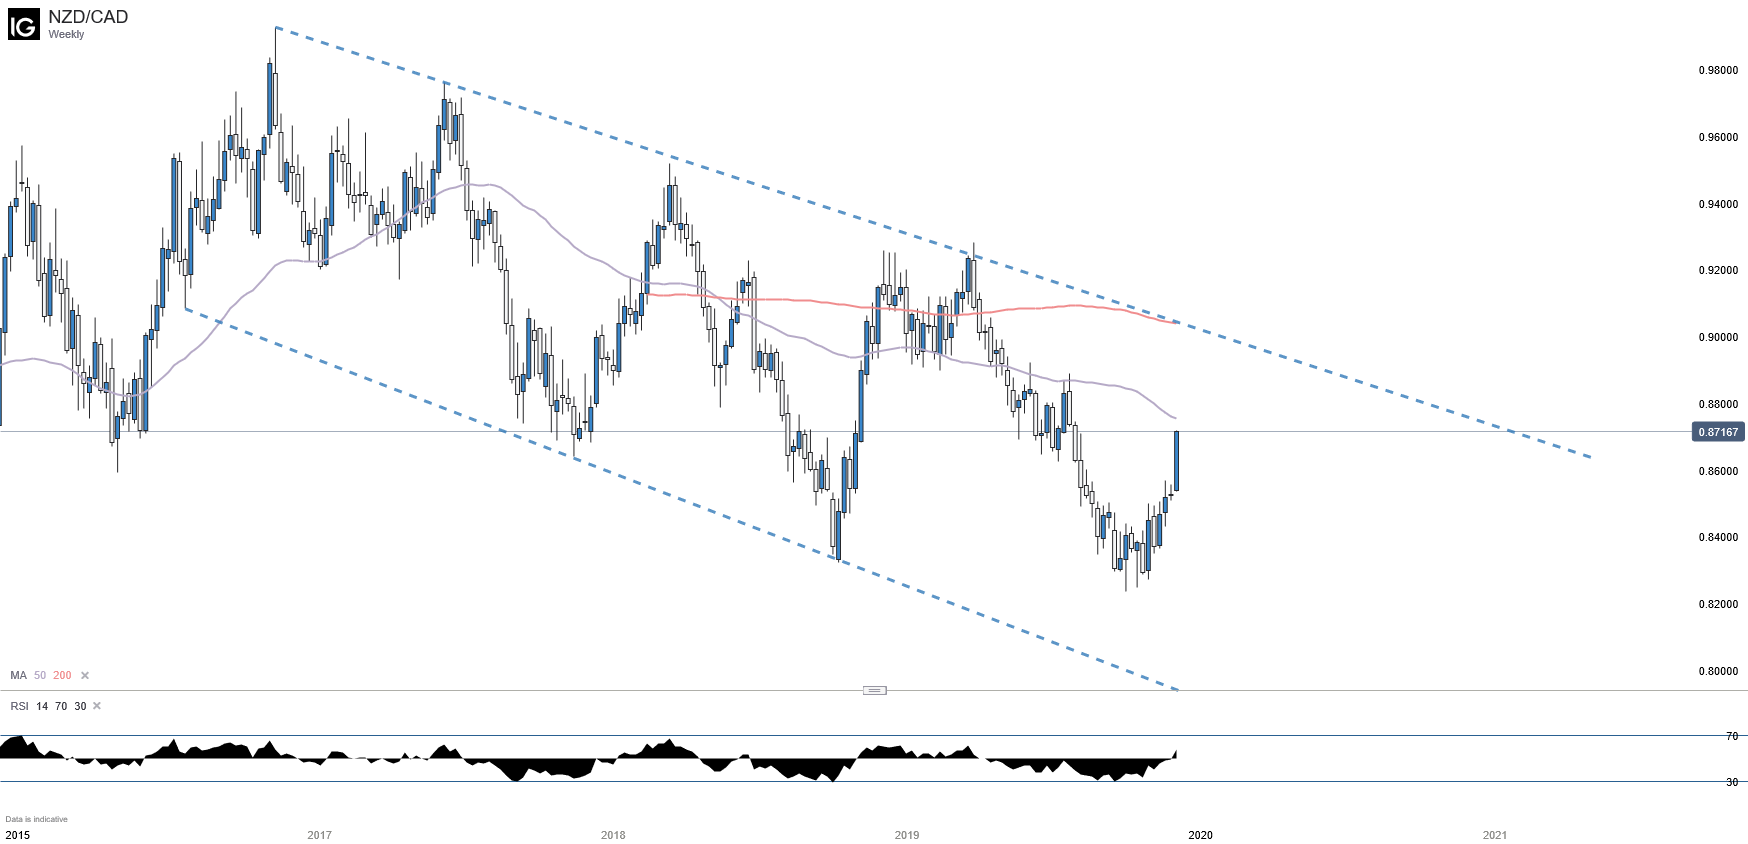
The New Zealand Dollar has shifted higher in recent weeks and continues to gain momentum. The recent strength was bolstered as the Canadian Dollar saw a fundamental breakdown this week from abysmal job numbers. On a weekly time frame, the pair sits under the 200-week and 50-week moving average, however recent strength sees the NZD approaching the 50-week. If the cross defeats this barrier it could go on to test the upper range of an establish downward channel that began in late 2016.
NZD/CAD Weekly Chart with 50- and 200-Week Moving Average
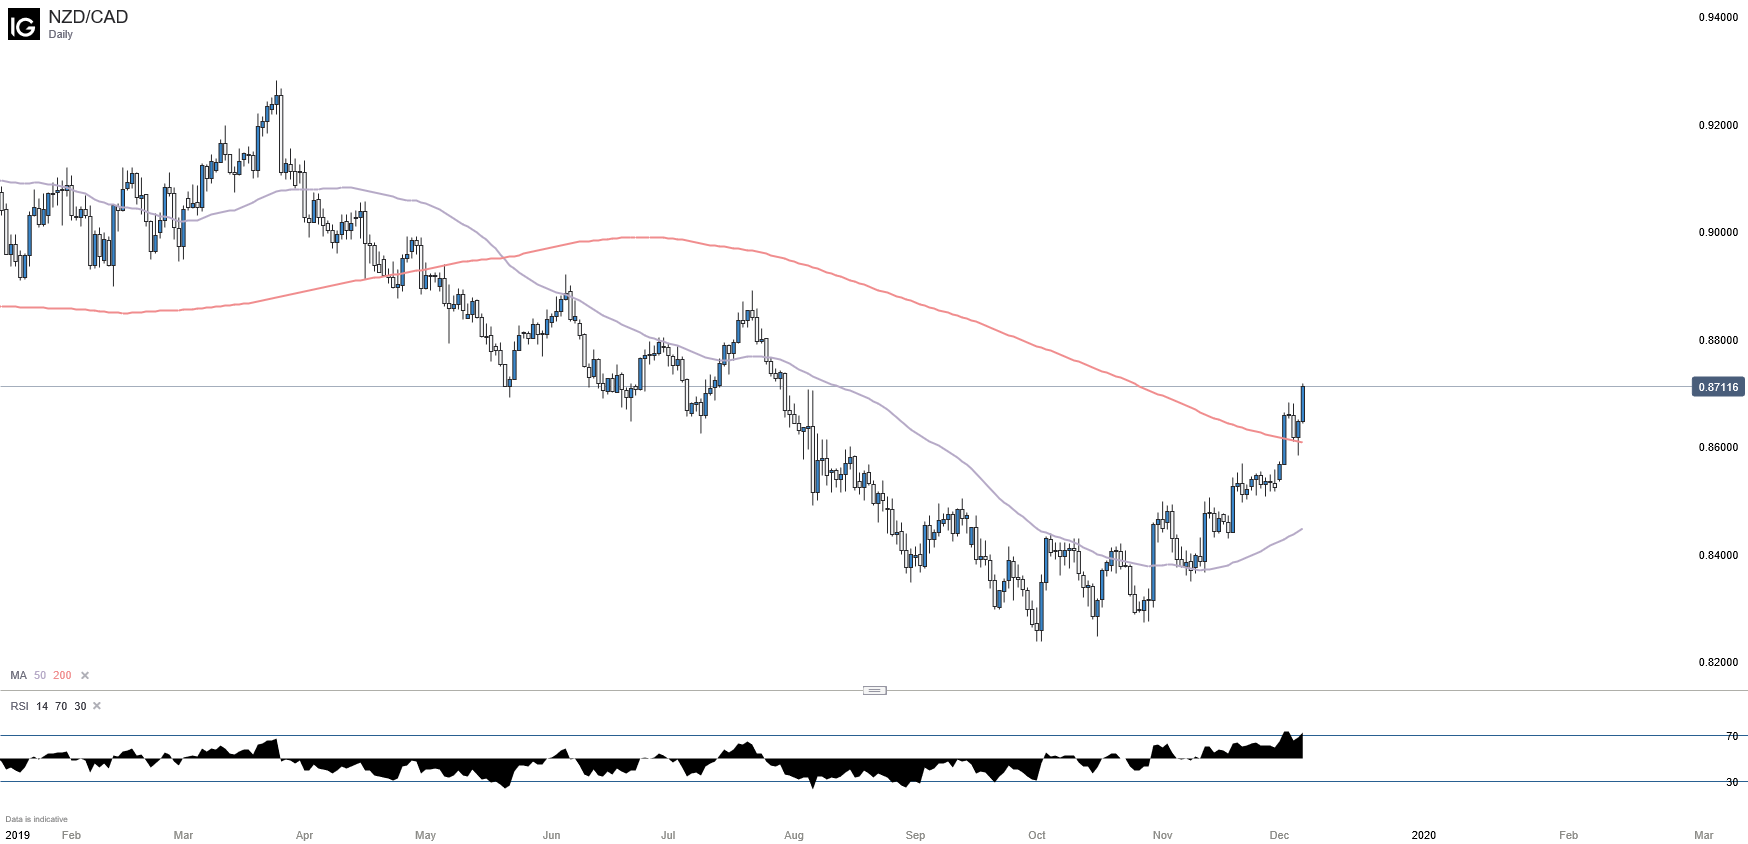
On a daily time, frame, the New Zealand Dollar has overtaken it’s 200-day moving average after shifting higher from the low of 0.82374 set on October 1. While the technical setup looks bullish, with the 50-day moving average turning up, RSI has breached above the 70 mark, indicating momentum could be nearing capacity in the short term. However, if the cross keeps shifting higher, watch for the 50-day moving average to overtake the 200-day to form a golden cross, which could help propel NZD/CAD higher.
NZD/CAD Daily Chart with 50- and 200-Day Moving Average
NZD/CHF Technical Outlook
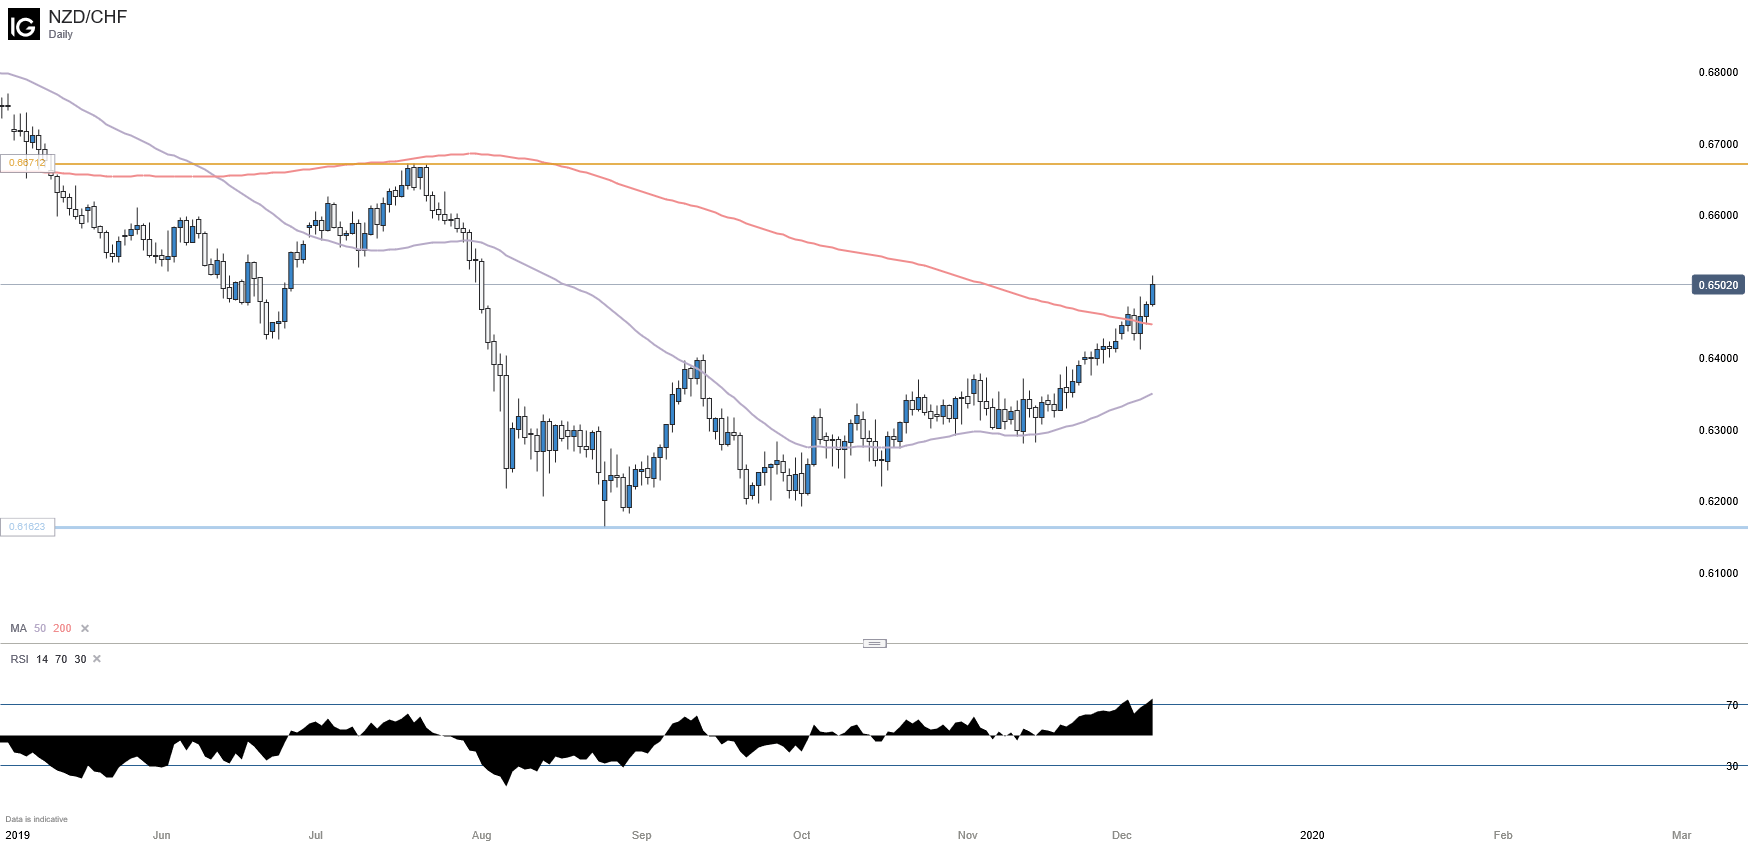
Versus the Swiss Franc, the Kiwi is reacting expectedly to the recent risk-on sentiment in the markets. The Kiwi has shifted higher against the safe-haven Franc as recessionary fears have subsided, sending equity markets in the US to new all-time highs. The cross has now breached it’s 200-day moving average and aims toward highs from July.
NZD/CHF Daily Chart with 50- and 200-Day Moving Average
NZD/JPY Technical Outlook
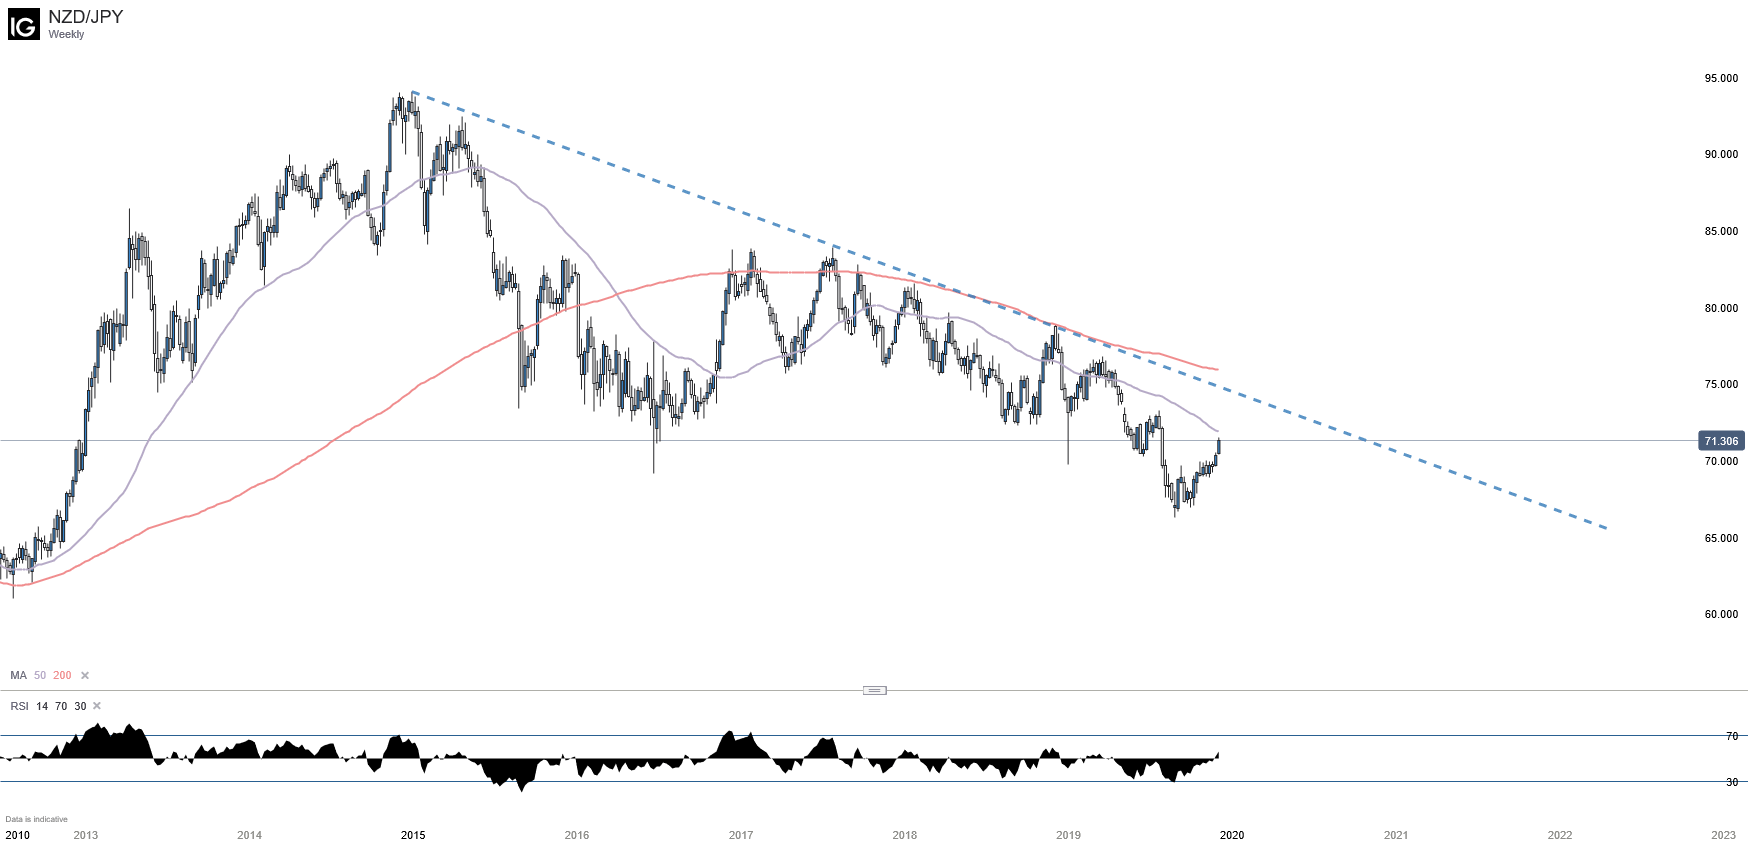
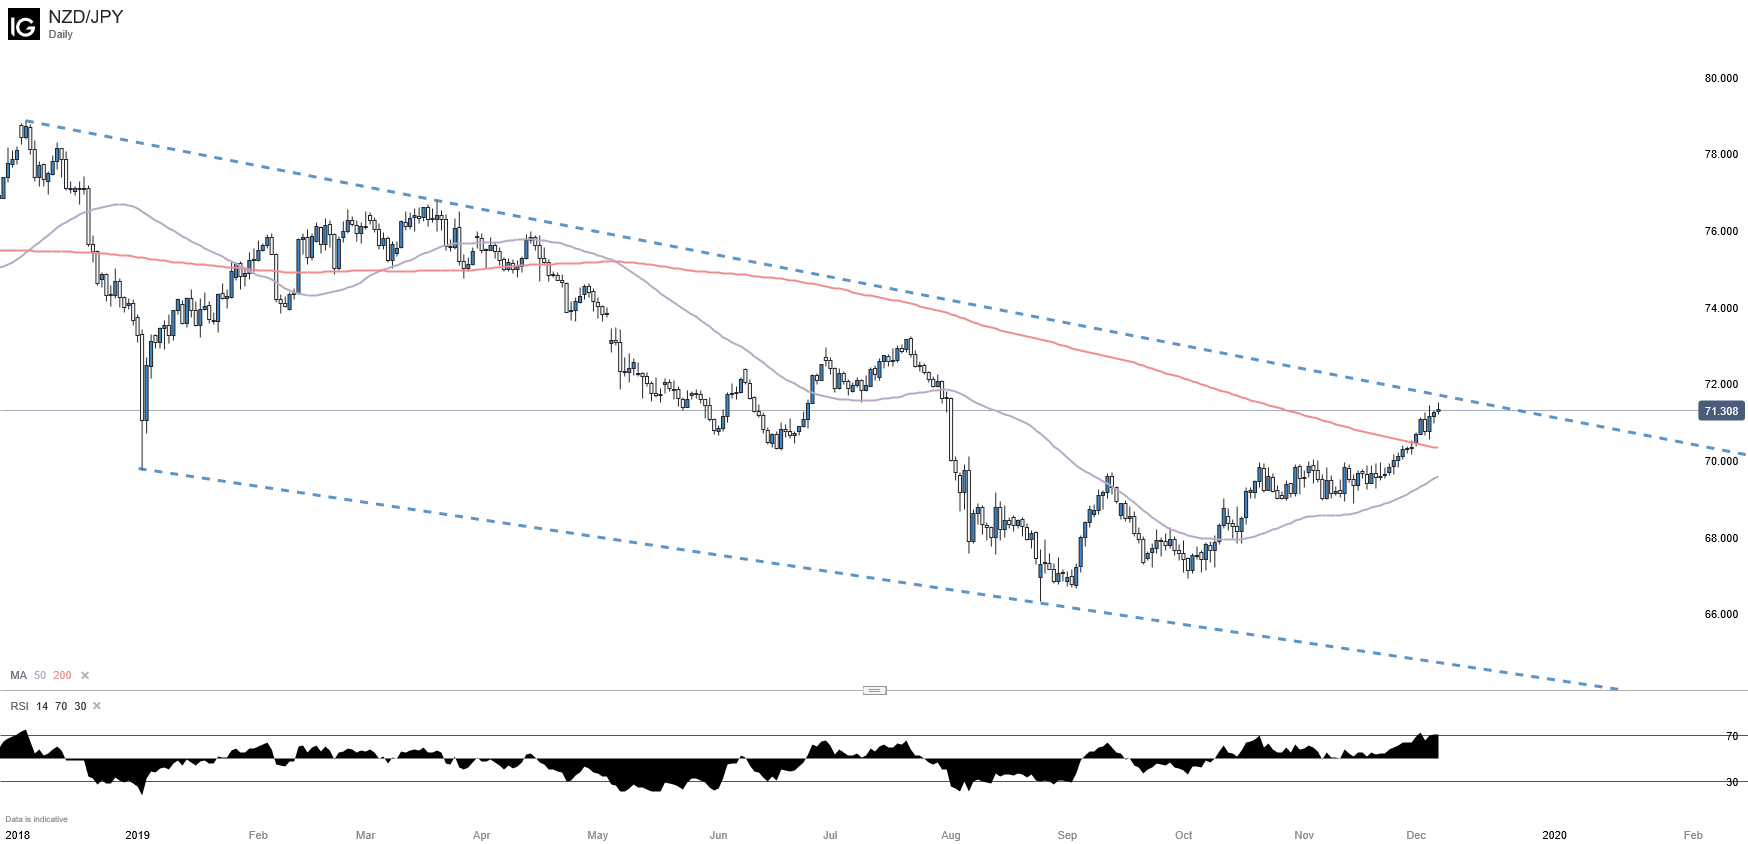
When facing the Yen, the Kiwi has enjoyed support from the same fundamental backdrop supporting it against the Franc since September. However, the technical picture is more questionable when viewing the weekly time frame for NZD/JPY. The cross has established a series of lower lows, and higher highs from mid-summer and has made several failed attempts at breaching it’s 200-week moving average. The Kiwi has also broken down past several areas on consolidation ranging back to 2015. If the pair could break its recent high 73.25 set on July 21, it could go on to break the established several-year downtrend.
NZD/JPY Weekly Chart with 50- and 200-Day Moving Average
Reinforcing the picture for short-term strength in the pair, the daily time frame hints at a more bullish picture for the coming weeks. The 200-day moving average has been cleared moving into December and continues to show momentum with the 50-day moving average accelerating upwards with potential for a golden cross.
NZD/JPY Daily Chart with 50- and 200-Day Moving Average
EUR/NZD Technical Outlook
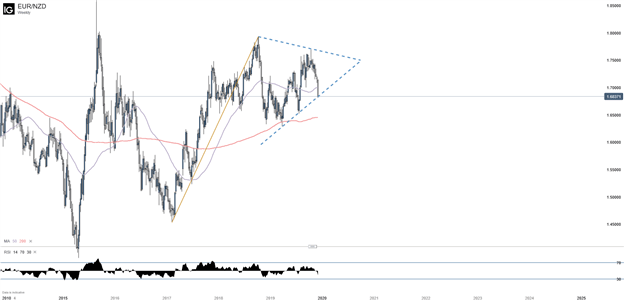
Against the Euro, the Kiwi technical picture appears bearish on a weekly timeframe. The Euro has made several higher highs in 2019 and when viewing the chart from farther out, a bullish pennant has formed. However, current price action is testing the lower bound of the pennant. If the bottom trendline holds, watch for price action to keep moving toward convergence. If the floor gives out, the 200-week moving average can act as support but would require a move to the lower range of the year.
EUR/NZD Weekly Chart with 50- and 200-Day Moving Average
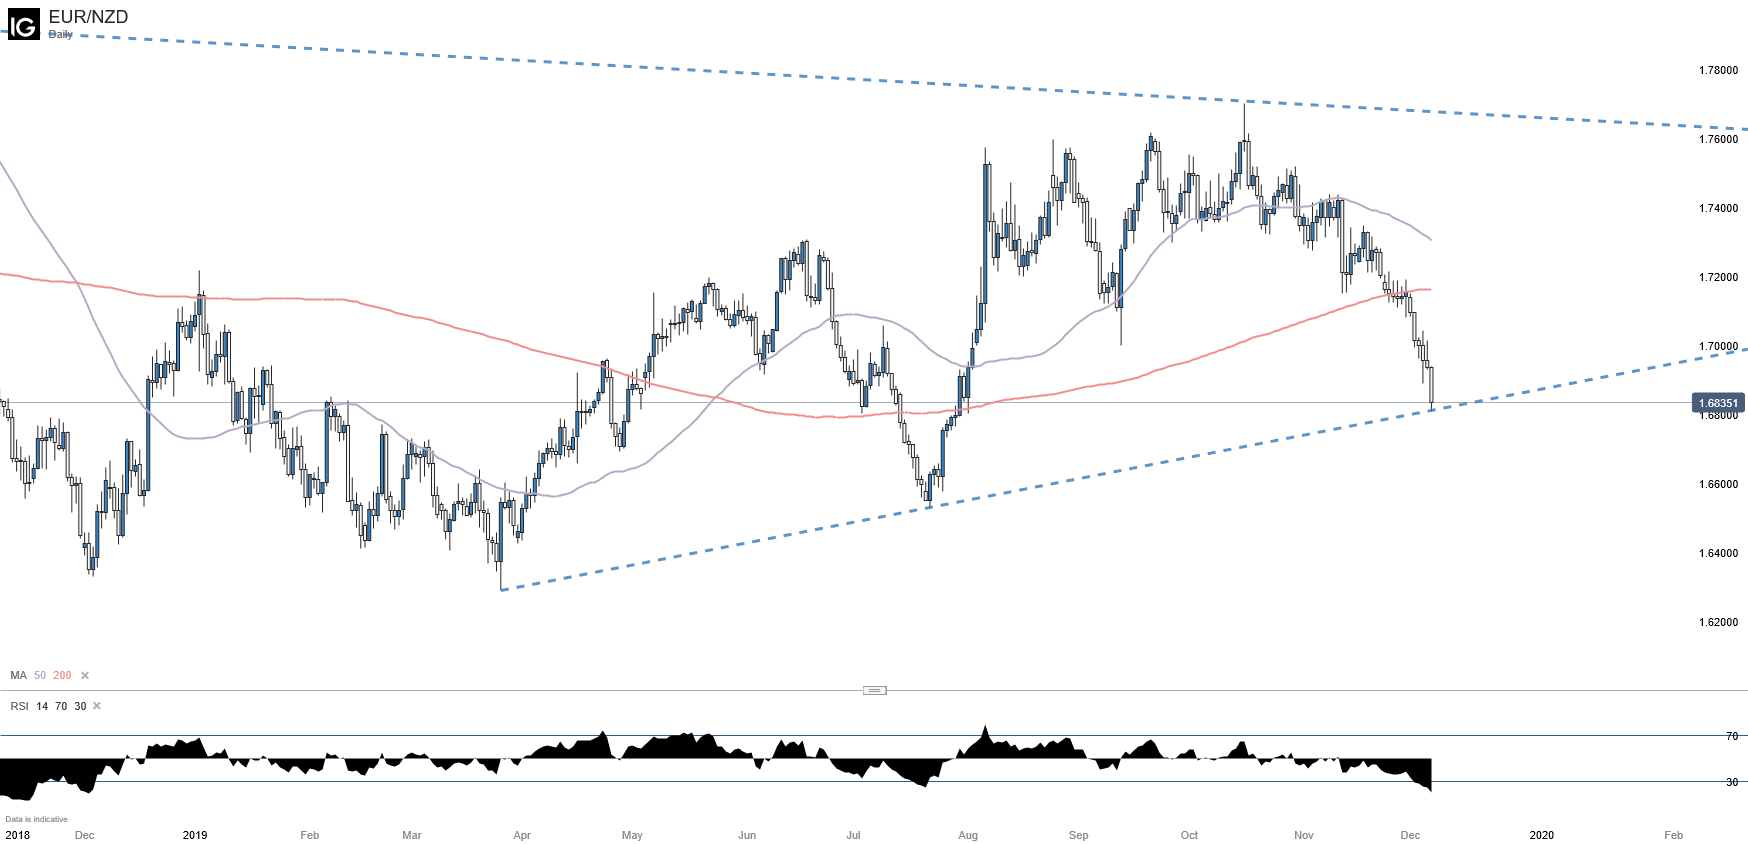
When viewing the cross on a daily time frame the bearish picture is still clear, however not as convincing. While the cross has shifted down in recent weeks, it now tests the bottom trendline established in March, which could support any further decline. The RSI is also at 20, indicating that the move down could be exhausted and perhaps work in unison with the trendline in stemming further declines. However, the 200-day moving average looms overhead. If the pair manages to hold support, watch for it to clear before confirming a move higher.
EUR/NZD Daily Chart with 50- and 200-Day Moving Average
--Written by Thomas Westwater, Intern Analyst for DailyFX.com
Contact and follow Thomas on Twitter @FxWestwater


