


Crude Oil Technical Forecast: Neutral
- Crude oil breaks supportive uptrend.
- Will 200-dma provide support or resistance?
Q4 Forecasts and Top Trading Opportunities
Crude Oil Sell-Off Brings Trend into Question
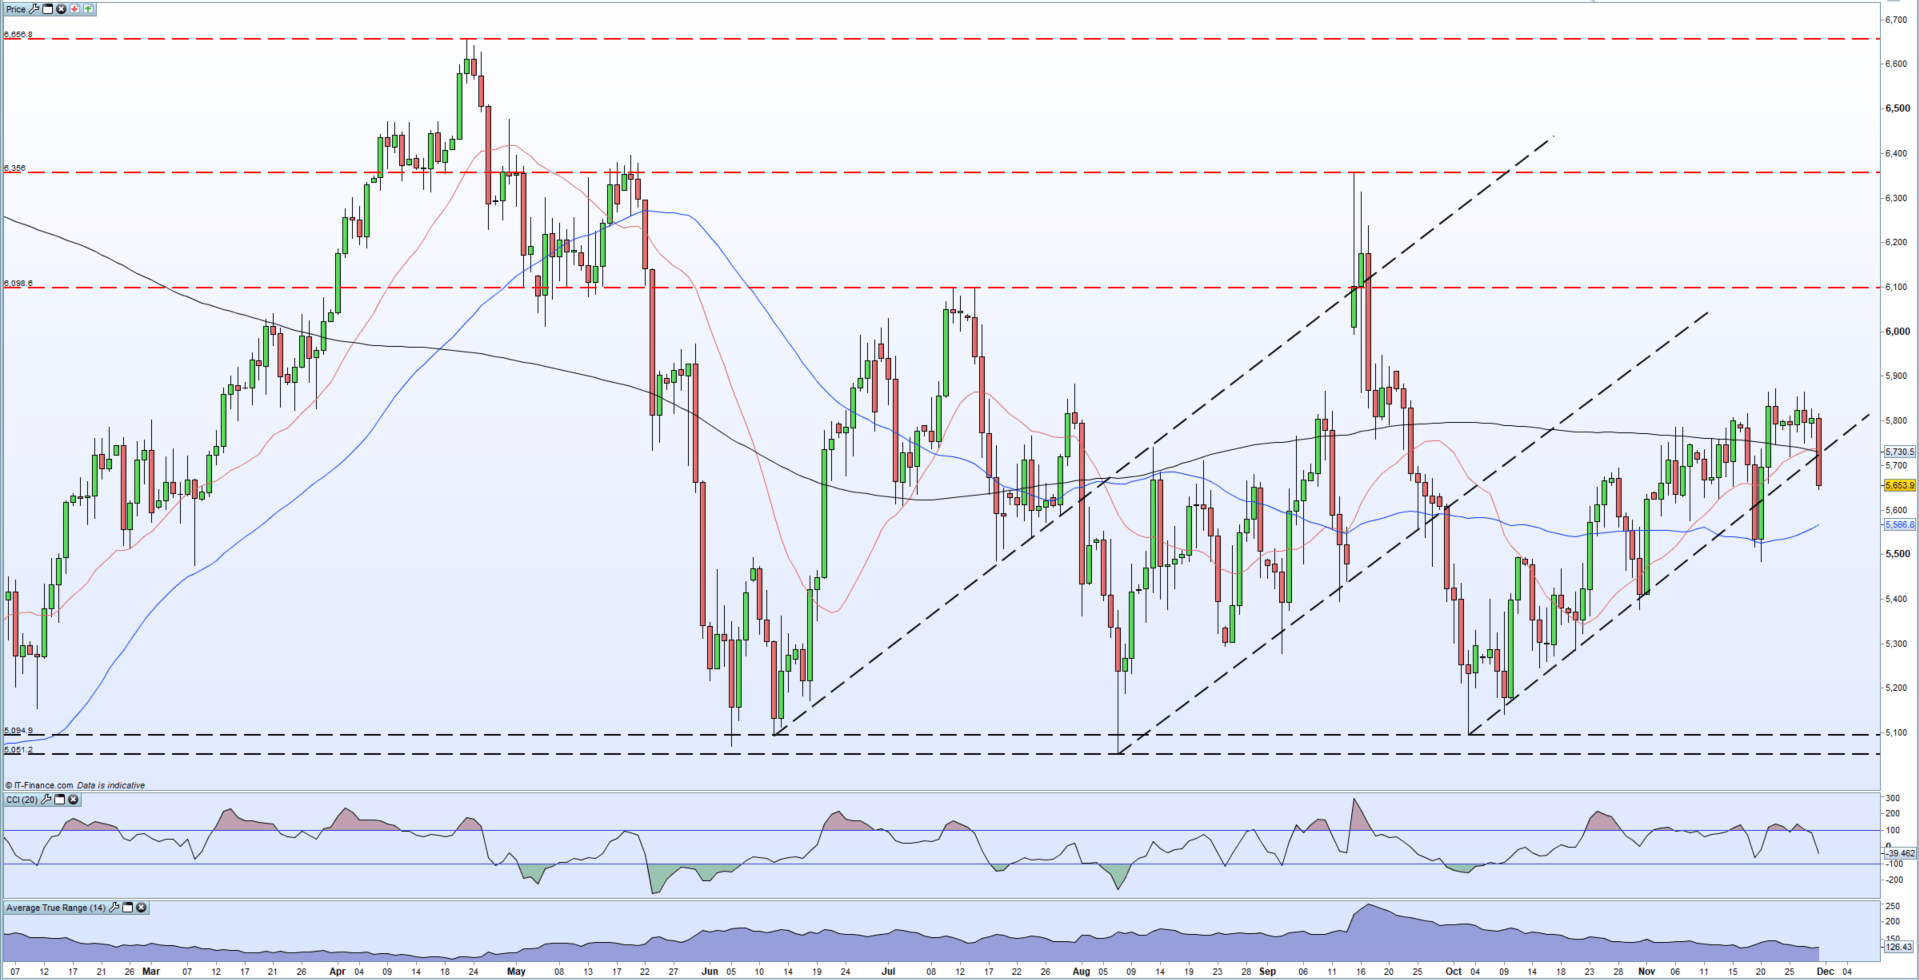
A sharp sell-off in crude today has seen the supportive uptrend off the October 3 low broken. Crude oil fell by 2% Friday and now trades at the lowest level this week. Traders will now have to see if this is a false breakout, similar to the one on November 19/20, or a confirmed break of the recent uptrend. Oil is being sold off on heightened fears of an escalation of the US-China trade dispute and worries over next week’s OPEC+ meeting.
Bearish traders will point to today’s price action sending oil below both the 20- and 200-dma, breaking short-term and long-term bullish sentiment, as confirmation of the sell-off which is taking a familiar pattern to markets over the last five months. This is the third time since early June that a rally from the $50.5 - $51.0/bbl. level has produced a series of higher lows before a sharp break lower.
Today’s break looks bearish and a close at or near its low will add further downside pressure to price action and bring the 50-dma at $55.66/bbl. and the November 20 low at $54.68/bbl. into view.
A close back above trend resistance, and the 200-dma, would help steady oil bull’s nerves, while a confirmed close above the November 22 candle at $58.60/bbl should see crude move higher still.
For a full rundown of all market moving economic data and events, including next week’s important OPEC+ meeting on December 5-6, see the DailyFX Calendar
Crude Oil Daily Price Chart (February – November 29, 2019)
IG Client Sentiment shows that traders are 57% net-short US crude oil, a bullish contrarian bias. However daily and weekly positional shifts give us a bearish bias.
Traders may be interested in two of our trading guides – Traits of Successful Traders and Top Trading Lessons – while technical analysts are likely to be interested in our latest Elliott Wave Guide.
What is your view on crude oil – bullish or bearish?? You can let us know via the form at the end of this piece or you can contact the author at nicholas.cawley@ig.com or via Twitter @nickcawley1.


