


British Pound Technical Forecast
- Fundamental Brexit risks cloud British Pound technical analysis
- GBP/USD may be carving out 4-year bearish candlestick pattern
- Can EUR/GBP sustain downtrend as GBP/JPY accelerates rise?
Check out our Q4 British Pound forecast to learn about where Sterling may go into 2020
DISCLAIMER
Over the past two weeks, the British Pound soared on rising hopes of a Brexit deal. This weekend, the UK Parliament will vote on whether to approve Prime Minister Boris Johnson’s agreement with the EU. Given the nature of unpredictability here, a failure to pass it risks reversing recent upside progress in Sterling, as such GBP technical analysis ought to be treated with a grain of salt amid heightened expected volatility.
GBP/USD Technical Outlook
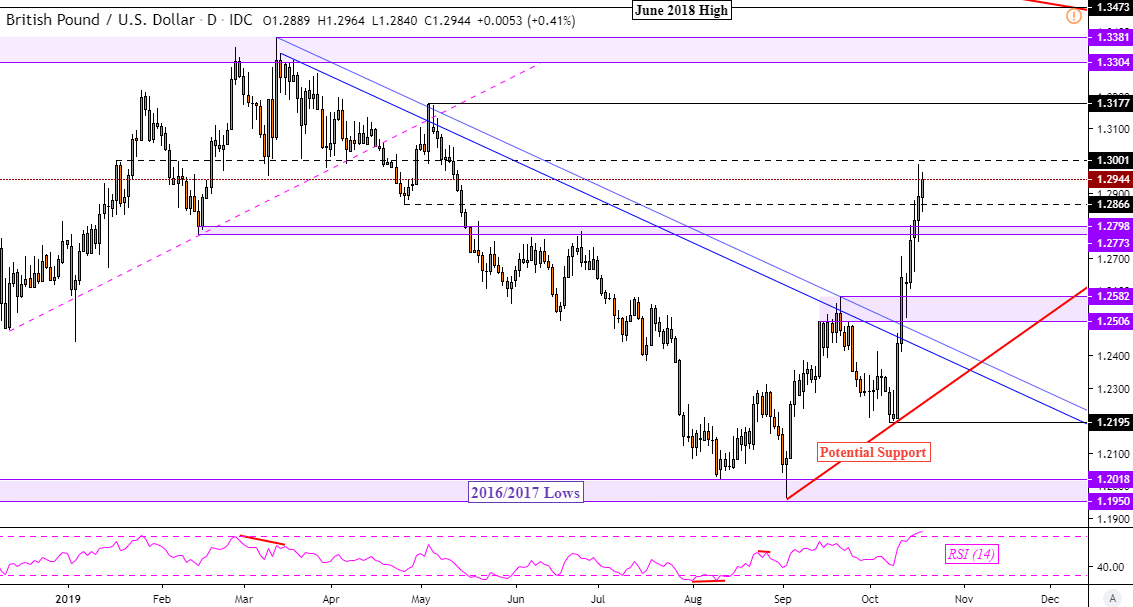
Last week, GBP/USD accelerated its advance after clearing the descending channel of resistance going back to March. Along its path, the next psychological barrier was taken out (1.2773 – 1.2798) as the pair overturned its dominant downtrend. As such, we may continue to see upside progress in the week ahead with prices eyeing near-term resistance at 1.3001 followed by 1.3177 before targeting the March highs.
The latter is a horizontal barrier between 1.3304 to 1.3381 which held throughout 2018 as prices were unable to close above it. On the other hand, a turn lower would eventually pave the way for a retest of former resistance which could act as new support as a range between 1.2582 to 1.2506. Beyond that lays would could be a potential rising trend line from the end of September – red line below.
GBP/USD Daily Chart
If I zoom out to the weekly GBP/USD chart, there appears to be a Descending Triangle candlestick formation brewing. This has been going on for over four years and may define the long-term trajectory of the pair. This is a bearish pattern that implies a continuation of the dominant downtrend. The ceiling acts as descending resistance going back to June 2015. The floor has its origins from 2016, 2017 and current 2019 lows.
GBP/USD – Weekly Chart

EUR/GBP Technical Outlook
Versus the Euro, the British Pound is at its strongest since May as EUR/GBP continues its downtrend from August. Prices were left sitting on support at 0.8620 which is around the former low from April 2018. Beyond that lays a psychological range (0.8472 – 0.8530) followed by (0.8338 – 0.8300). Otherwise, reversing higher may eventually pave the way for a test of what could be potential descending resistance – red line below.
EUR/GBP Daily Chart

GBP/JPY Technical Outlook
Meanwhile, the British Pound is sitting right under key resistance against the Japanese Yen (140.69 – 141.51). Taking this out then exposes the next psychological barrier (143.79 – 144.13) as GBP/JPY resumes its uptrend towards March highs. Otherwise, a turn lower has near-term support at 137.79 followed by 135.61. Taking these out paves the way for a test of what may be potential rising support from September – blue line below.
For more updates on the British Pound, including on the fundamentals, you can follow me on twitter here @ddubrovskyFX. You may also join me each week on Wednesdays at 00:00 GMT where I will be taking a look at how you can use IG Client sentiment as a third element in market analysis.
GBP/JPY Daily Chart

FX Trading Resources
- Having trouble with your strategy? Here’s the #1 mistake that traders make
- See how the British Pound is viewed by the trading community at the DailyFX Sentiment Page
- Just getting started? See our beginners’ guide for FX traders
--- Written by Daniel Dubrovsky, Currency Analyst for DailyFX.com
To contact Daniel, use the comments section below or @ddubrovskyFX on Twitter


