


Gold Price Technical Outlook:
- Gold selling in week ahead could help fill out developing bull-flag
- May take time, but an eventual break of long-term resistance looks ahead
Check out the intermediate-term fundamental and technical factors at work in the Q4 Gold Forecast.
Gold selling in week ahead could help fill out developing bull-flag
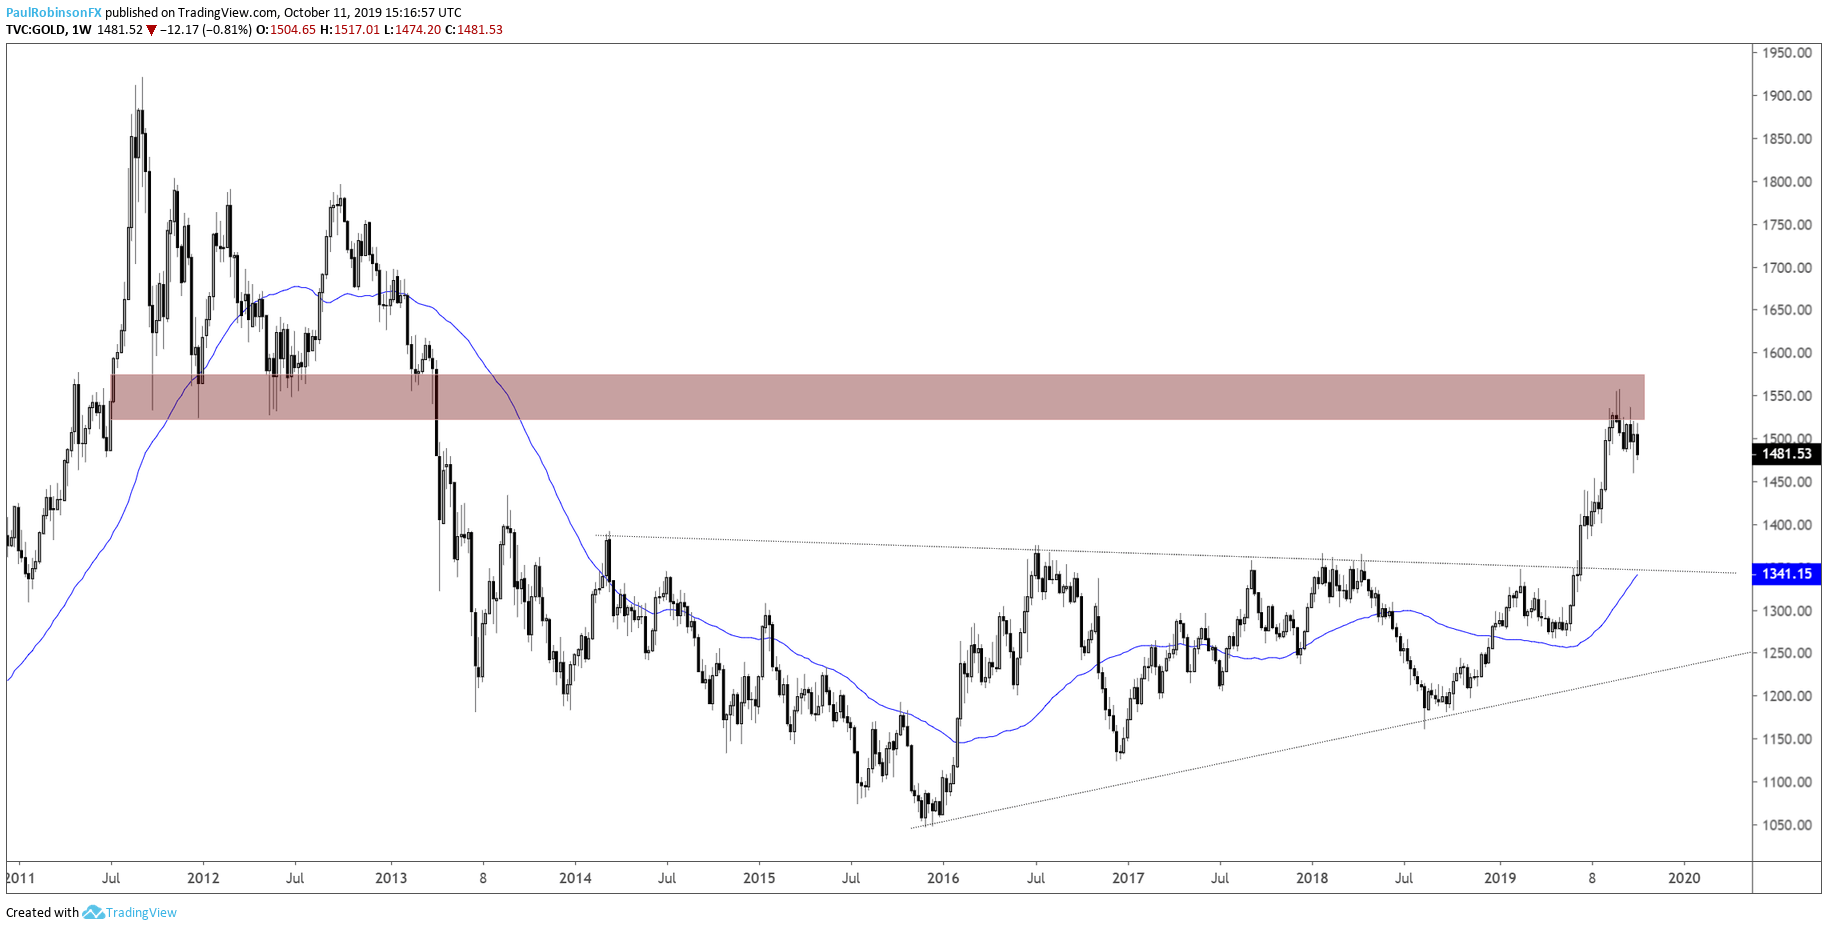
Gold dropped to end last week, coming off resistance via an upper parallel extending lower from the early-September peak. This keeps near-term pressure on gold as it continues to back-and-fill from resistance created during the 2011/12 topping process.
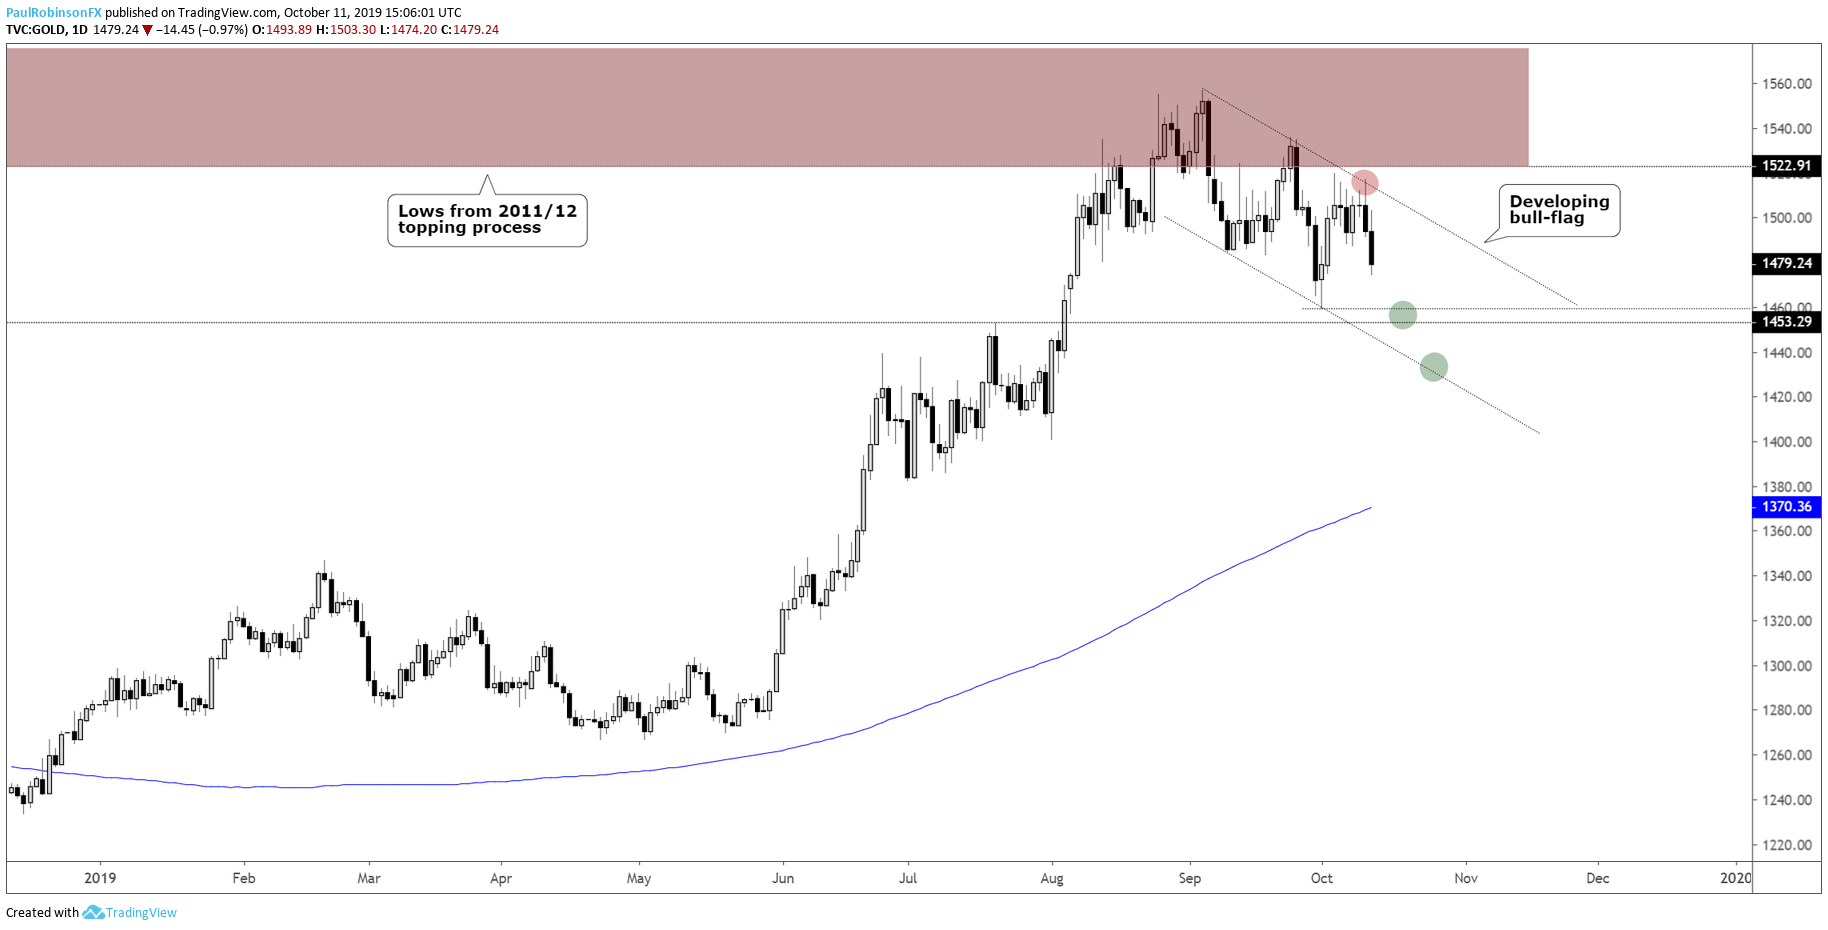
First up as support is the October 1 low at 1459, followed by the July high at 1453. Beneath these two levels is the lower parallel tied to the trend-line off the September high. The parallel lines together are making a bull-flag that at some point could lead to a surge through the thicket of resistance from the 1520s up to 1575.
The bull-flag could use more time to develop, and if it is to come to fruition then momentum in both directions will be quick to turn as the digestion process runs its course. In the week ahead, this would mean a bit more weakness followed by another push higher off one of the aforementioned support levels, the lower parallel as the lowest point before the bull-flag begins to fall apart.
Check out the IG Client Sentiment page to find out how changes in retail positioning could signal the next price move in major markets.
Gold Price Weekly Chart (2011/12 levels remain a capper)
Gold Price Daily Chart (weakness to further build bull-flag)
Gold Price Charts by TradingView
Helpful Resources for Forex Traders
Whether you are a new or experienced trader, we have several resources available to help you; indicator for tracking trader sentiment, quarterly trading forecasts, analytical and educational webinars held daily, trading guides to help you improve trading performance, and one specifically for those who are new to forex.
---Written by Paul Robinson, Market Analyst
You can follow Paul on Twitter at @PaulRobinsonFX


