


GOLD PRICE FORECAST – WEEKLY TECHNICAL OUTLOOK:
- The price of gold sank 1% since last Friday and marks the commodity’s second consecutive week of declines
- Gold price action could sour further and jeopardize its bullish run if technical confluence fails to provide support for the precious metal
- Don’t miss out on this key insight detailing the Top Gold Trading Strategies
Gold prices now trade roughly 3% below the multi-year high XAUUSD printed earlier this past week. The recent top was made on negative MACD divergence, which suggested that upward momentum has faded as bullish momentum ebbs. The aggressive pullback in the price of gold sank XAUUSD below its first uptrend line of defense provided the first major technical blow. Also, with gold prices far from immune to safe-haven selling pressure, downside in spot gold prices was subsequently exacerbated amid plunging volatility and resurfacing risk appetite largely owing to upbeat US-China trade war developments.
GOLD PRICE CHART: DAILY TIME FRAME (MARCH 20, 2019 TO SPETEMBER 06, 2019)
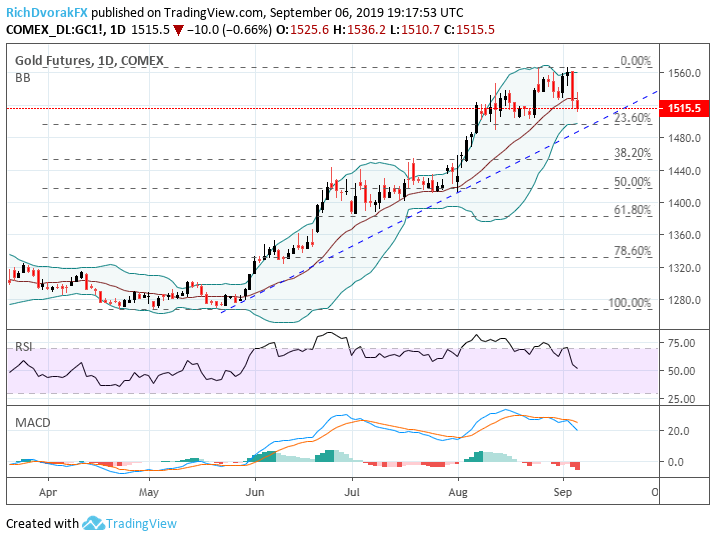
Chart created by @RichDvorakFX with TradingView
Turning to the charts, this past week’s slide in gold prices could chalk up to be a healthy pullback – especially when taking the impressive ascent in XAUUSD since late May into perspective. Yet, the magnitude of last week’s drop in the price of gold has several traders questioning the sustainability of the commodity’s recent bullish stretch. We noted earlier that the September 4 high in XAUUSD was made on negative MACD divergence as the RSI dipped below a reading of 70 and “overbought” level.
Also, the sharp drop in gold prices sent the precious metal below its 20-day simple moving average. Looking ahead, however, the price of gold will likely turn to technical confluence around the psychologically-significant $1,500 level and is highlighted by the 23.6% Fibonacci retracement of XAUUSD’s year-to-date trading range. A bullish uptrend line extended from the May 30 and August 1 swing lows could also be looked to for potential technical support.
GOLD PRICE CHART: 4-HOUR TIME FRAME (JULY 31, 2019 TO SEPTEMBER 06, 2019)
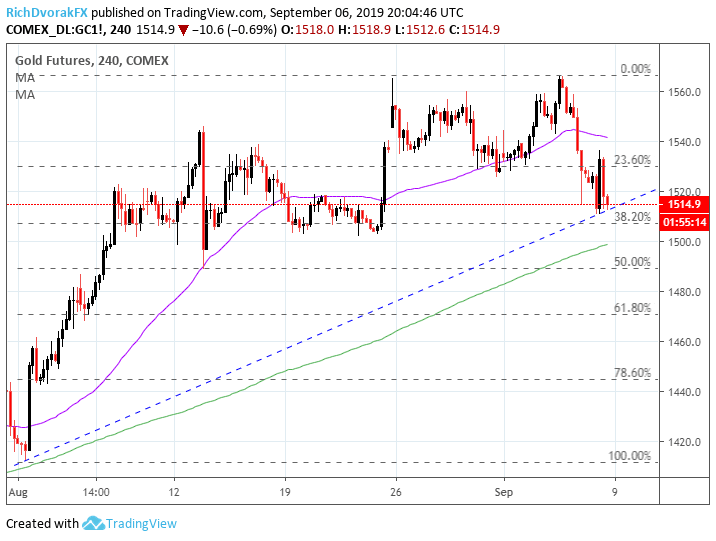
Chart created by @RichDvorakFX with TradingView
XAUUSD technical confluence slightly above $1,500 is also underscored by the 38.2% Fibonacci retracement level of gold’s trading range since August 1. While the uptrend line extended from the August 1 low to this Friday’s low may be premature, gold bulls could look to this area of support early next week for potential signs of a rebound or if XAUUSD selling pressure appears set to continue.
The 200-SMA is also worth keeping close tabs on as it stands to provide a degree of buoyancy to spot gold prices as well. Beneath these key technical levels, the August 13 swing low and mid-point retracement of gold’s trading range since last month might be looked to as a last-ditch effort to keep XAUUSD afloat. If the price of gold attempts to recover next week, technical confluence around the $1,530 price level and 23.6% Fibonacci retracement could keep a lid on upside progression. Above this resistance zone, spot gold prices could eye its 50-SMA.
SPOT GOLD VS GOLD VOLATILITY PRICE CHART: DAILY TIME FRAME (OCTOBER 22, 2018 TO SEPTEMBER 06, 2019)
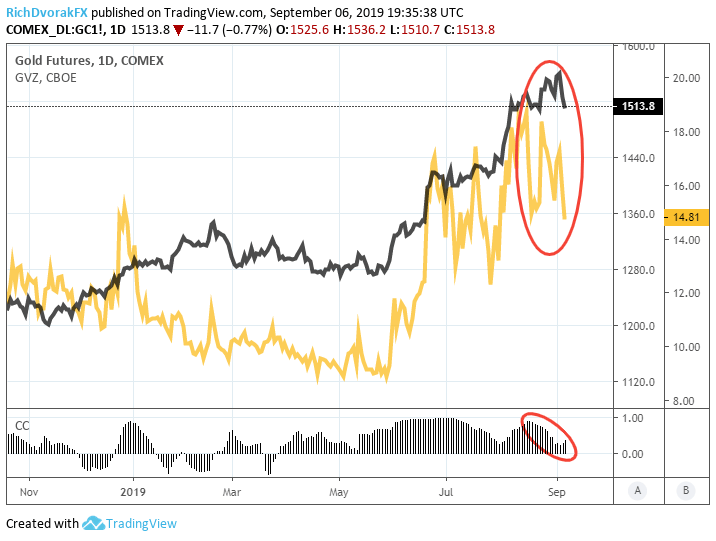
Chart created by @RichDvorakFX with TradingView
The relationship between spot gold and GVZ – Cboe’s 30-day implied gold price volatility index – is also worth watching closely as risk trends unfold and traders digest the latest macroeconomic developments. We highlighted how volatility crumbled while risk assets soared this past week, predominantly driven by US-China trade war optimism, which will likely serve as a major headwind for upside progression in gold prices and safe-havens alike going forward.
That said, the correlation between gold prices and GVZ has dropped noticeably from its near-perfect direct relationship. This could indicate that trader demand for gold lingers despite the recent influx of risk appetite. Nevertheless, the positive relationship remains intact and, in turn, the steep slide in GVZ could hint that additional weakness is ahead for gold prices – particularly if gold volatility sinks further.
-- Written by Rich Dvorak, Junior Analyst for DailyFX.com
Connect with @RichDvorakFX on Twitter for real-time market insight


