


Gold Prices Talking Points:
- Gold prices set a fresh six-week-high after this week’s open, but that strength didn’t remain as the rest of the week saw prices push lower to go along with a lower-high.
- While Gold prices do remain overbought, the fundamental backdrop may allow for further gains particularly around key Central Bank rate decisions in the middle two weeks of September. This could spell for a backdrop to look for pullbacks to support to open the door for longer-term bullish strategies.
Gold Prices Technical Forecast for Next Week: Bullish
The bulk of this week’s excitement in Gold showed before NY traders got to their desks on Monday morning. Prices started by jumping higher after the Sunday open and price action made a strong push up to the 1550 level, with Gold futures even touching the 1565 level. As mentioned shortly after that breakout, a bit of support remained at the 1527 level, which is the 23.6% Fibonacci retracement of the bullish move that ran from 1999-2011, and this price had previously helped to set some resistance a couple of weeks ago.
That support inflection led to another topside test of the 1550 level, which turned around the bullish advance yet again with price action quickly returning back to the 1527 Fibonacci level.
Gold Price Two-Hour Price Chart
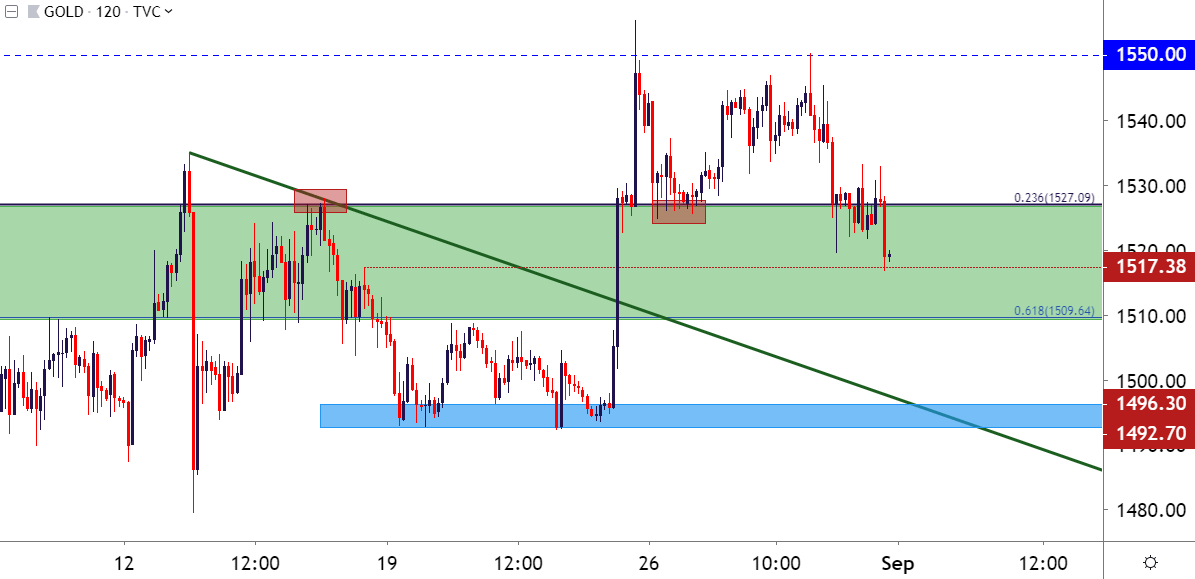
Chart prepared by James Stanley; Gold on Tradingview
Taking a step back to the weekly chart and the net of this week’s price action has been a shooting star formation. Such formations will often be approached in a bearish manner, looking for reversal after early-period enthusiasm was soundly faded out of the market, with the bar’s close finishing below its open price.
Normally, such a backdrop would open up to the possibility of reversal scenarios; but what’s been taking place in Gold of recent has been anything but normal. Given the context, in which a strong gust of USD-strength showed-up on the final trading day of August, amidst a low-liquidity backdrop in-front of a holiday weekend, and the fact that Gold prices didn’t further sell-off could be looked at as a de facto item of positivity. It does, however, urge caution from chasing the move at this point as the potential for a deeper pullback may be developing, keeping focus on potential support levels such as 1500 or, perhaps even as deep as 1453 or the prior resistance zone at 1421-1433 as a deep overbought scenario in Gold resets after a very strong three-month-run.
Gold Price Weekly Chart
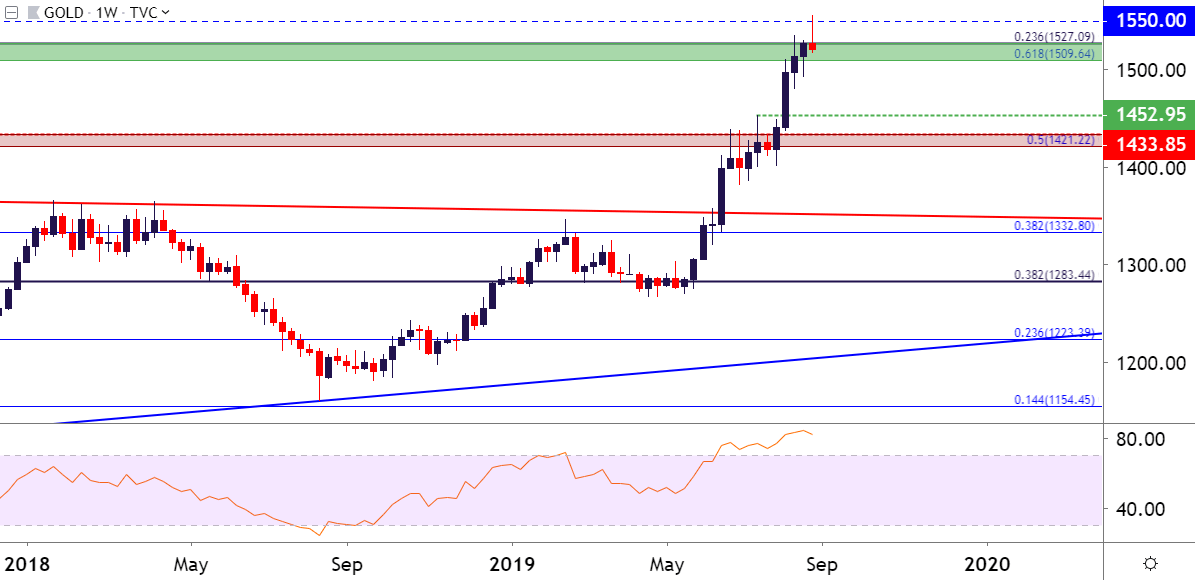
Chart prepared by James Stanley; Gold on Tradingview
Gold Technical Forecast for Next Week: Neutral
For next week the technical forecast will be set to neutral on Gold. That could quickly change should support show at a prior area of resistance, such as the two longer-term zones mentioned above. For the bid-side of Gold, the two weeks in the middle of September are most interesting as Central Bank rate decisions take place out of Europe and then the United States. If Gold bulls are going to get the motivation that they’ve been looking for then, likely, it will come from dovish postures at one or, perhaps both of these meetings.
For now – the focus is on support and how far bulls might let this drop before rushing back-in to continue the topside theme, and on the below chart four different areas of interest are identified down to prior July resistance (1421-1433), each of which have already had some element of pull on price action with recent support and/or resistance inflections.
Gold Four-Hour Price Chart
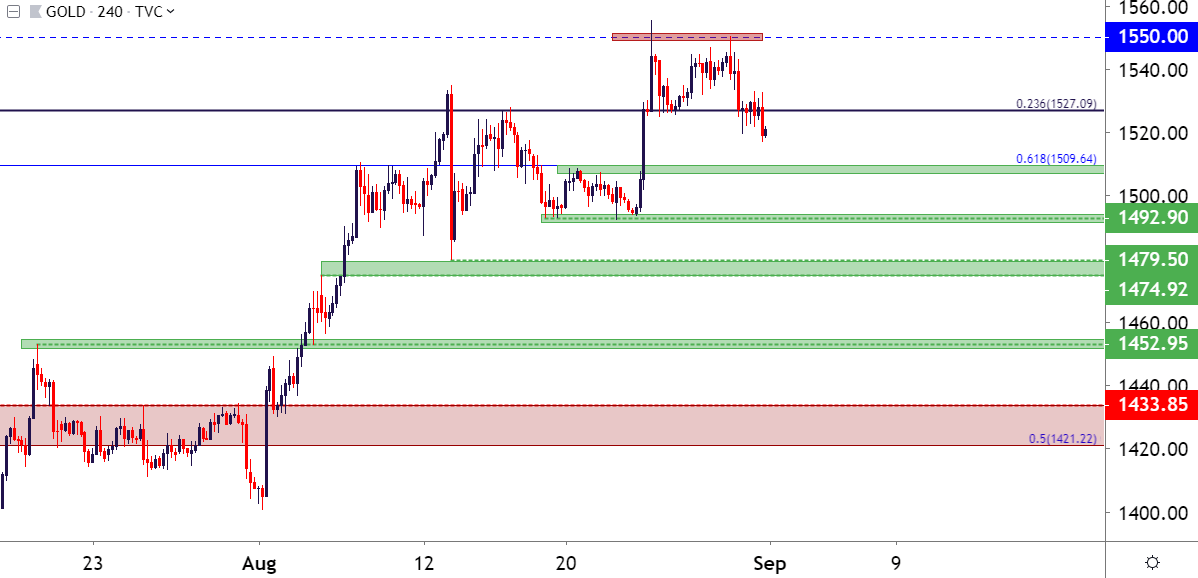
Chart prepared by James Stanley; Gold on Tradingview
To read more:
Are you looking for longer-term analysis on the U.S. Dollar? Our DailyFX Forecasts have a section for each major currency, and we also offer a plethora of resources on Gold or USD-pairs such as EUR/USD, GBP/USD, USD/JPY, AUD/USD. Traders can also stay up with near-term positioning via our IG Client Sentiment Indicator.
Forex Trading Resources
DailyFX offers an abundance of tools, indicators and resources to help traders. For those looking for trading ideas, our IG Client Sentiment shows the positioning of retail traders with actual live trades and positions. Our trading guides bring our DailyFX Quarterly Forecasts and our Top Trading Opportunities; and our real-time news feed has intra-day interactions from the DailyFX team. And if you’re looking for real-time analysis, our DailyFX Webinars offer numerous sessions each week in which you can see how and why we’re looking at what we’re looking at.
If you’re looking for educational information, our New to FX guide is there to help new(er) traders while our Traits of Successful Traders research is built to help sharpen the skill set by focusing on risk and trade management.
--- Written by James Stanley, Strategist for DailyFX.com
Contact and follow James on Twitter: @JStanleyFX


