


Crude Oil Technical Outlook:
- WTI crude oil bouncing off support, but not seen as lasting
- Brent crude oil looks headed towards t-lines from 2016
For the intermediate-term fundamental and technical outlook, check out the Q3 Crude Oil Forecast.
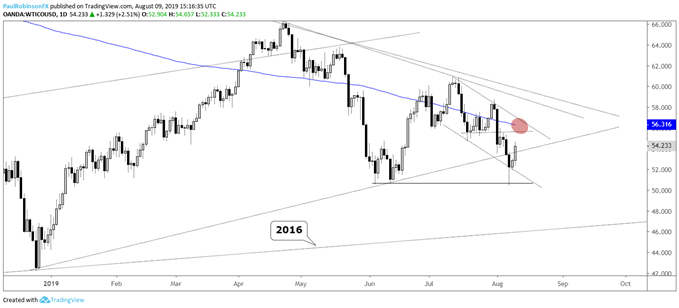
WTI crude oil bouncing off support, but not seen as lasting
Crude oil has been slumping hard lately and things could continue to worsen after a short-term reprieve. The situation could turn outright nasty if stocks roll over, certainly a distinct possibility. WTI is the stronger of the two major contracts, with it still above the June low and Brent trading below.
The technical outlook is murky at the immediate moment as things have turned a bit choppy near-term. Solid price levels aren’t readily available, but the 55.60/56.30-area (July lows/200-day) look likely to prove problematic.
On the downside, to get momentum going again the weekly/June low will need to be broken, looking at sub-50.47 for this to develop. All-in-all, risk/reward isn’t optimal at this juncture. That should clear up here shortly though as we progress through the week. Generally speaking, looking for lower prices to unfold.
Check out the IG Client Sentiment page to find out how changes in positioning in major markets could signal the next price move.
WTI Crude Oil Daily Chart (Sloppy price action at the moment)
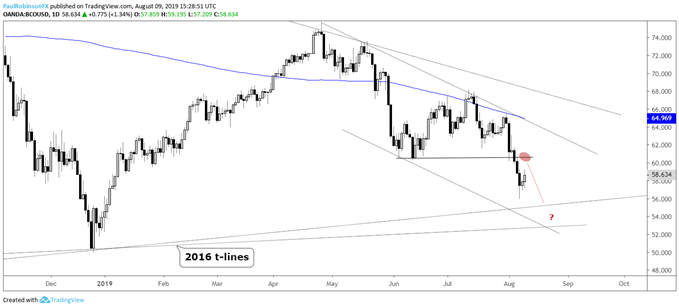
Brent crude oil looks headed towards t-lines from 2016
Lately, the Brent contract hasn’t fared as well as its U.S. counterpart, which makes it more vulnerable to more selling ahead. This makes the U.K. contract more appealing as a short candidate once a bounce plays itself out. Watch the June low at 60.28 for resistance. On another round of weakness watch a pair of trend-lines running over from 2016 as support; 55/52.50-area.
Brent Crude Oil Daily Chart (June low resistance, targeting 2016 t-lines)
Helpful Resources for Forex Traders
Whether you are a new or experienced trader, we have several resources available to help you; indicator for tracking trader sentiment, quarterly trading forecasts, analytical and educational webinars held daily, trading guides to help you improve trading performance, and one specifically for those who are new to forex.
---Written by Paul Robinson, Market Analyst
You can follow Paul on Twitter at @PaulRobinsonFX


