
Dollar Talking Points:
- Momentum behind the recovery from a failed head-and-shoulders breakdown has been capped
- There is a high probability of volatility but technical and fundamental barriers to trend development
- See what we expect from the Dollar – and other key currencies, indices and commodities – over the third quarter
Technical Forecast for Dollar: Neutral
The Dollar has experienced a number of key reversals these past weeks. From the currency’s failure to stretch its slow run to multi-year highs back in late May, we have seen the benchmark trigger a high-tension technical breakdown pattern only then to see conviction snuffed out with a reversal back into range. The question we should have as traders is whether it is happenstance that a speculative motivation sweeps in right at the moment that markets are due to hit critical velocity to establish a trend? Or, perhaps this is simply the nature of the market-at-large that attempts to forge breakout into a meaningful trend is ultimately doomed to fall apart. I lean towards the latter scenario, but these conditions will change and perhaps sooner than many in the traditional ‘risk’ space may expect.
Looking at the daily chart of the Dollar – ICE’s DXY Index – we can readily see the remnants of technical patterns that failed to hit full stride. The double top at 98.35 didn’t register as unrequited enthusiasm from the bulls. However, the drop through 96.50 which coordinated the 200-day moving average, 13-month channel floor and head-and-shoulders pattern ‘neckline’ was too visible to miss. If the markets were more balanced without restrictions on momentum development, that would have likely triggered a lasting move that didn’t truly level out until we returned to levels last seen mid-2018. Instead, we stalled immediately below the break point until it was prompted to rally back above 96.50 and comfortable within its range. Though not as dramatic, the recovery rally back into the range would also lose lift at 97.50 to an abrupt correction.
If it is difficult to develop trends in a market, it is consequently an environment that we should consider evaluating conditions through a lens of reversals and congestion.
Chart of DXY Dollar Index with 200-day Moving Average (Daily)
With such an overview in mind, we can step down the time frame so as not to fantasize about the eventual next big break and the future where a trend can actually gain traction. On the 8-hour or 4-hour time frame, the Dollar presents more reasonable levels. The 98.35 double top and five-month range floor around 95.85 are outer boundaries to the congestion that is currently holding back the tide of volatility. But volatility is absolutely what we are experiencing. There are more frequent and significant swings between these extremes. Interim levels do exist within those limits, but they are far less likely to hold up to sudden gusts of volatility – which seem a frequent occurrence of late. Keep a tab on key event risk due for release on the docket as well as the convergence of expected high liquidity such as during the London-New York crossover.
Chart of the DXY Dollar Index and 14-Period RSI (8-Hour)
While activity conditions are presently set to ‘congestion’ and are more likely to stay that way until some systemic shifts occur across the financial system – not just a US Dollar development – it is important to remind ourselves that the environment will eventually change. That may seem obvious or superficial, but when we grow dependent on a certain market type, there can be serious pain in adjusting to the new conditions. The range on the Dollar is still historically extreme in how restrictive it is. Below, we have the historical range of the past three months relative to spot price. There have been a few instances of restraint in the past (2014 and 1996) but the time taken to settle into this pattern is unprecedented. Eventually it will break, so determine what your cutoff is for calling the shift.
Chart of DXY Dollar Index and Historical 3-Month Range as Percentage of Spot (1-Month)
If the state of volatility behind the Dollar continues to bustle, a breakout is more likely to take place – though whether it is a break without follow through depends on exactly what it stirring the markets. I hold some significant degree of skepticism around monetary policy as a spark. This ventures into fundamentals, but it is easily charted when we compare the currency to implied yields from Fed Funds futures through years end (as we do below). While there is no doubt a measure of correlation between the two, the amplitude for rate forecasts necessary to simply encourage the break was clearly severe. That suggests that a trend out of this relationship would be very difficult to generate and even another break would necessitate a dramatic shift in Fed backdrop.
Chart of DXY Dollar Index and Implied Yield from December Fed Funds Futures (Daily)
Looking to volatility itself, there are still deflated readings coming from the official implied measures from the CME – for EURUSD, GBPUSD and USDJPY. With a tenor of a month, it is not surprising that anticipation for significant moves is restrained as two of those pairs have held larger ranges and Cable has seen its day-to-day activity heavily restricted by Brexit focus. However, the actual movement within the range is still quiet large and the frequency of intra-week reversals is high. It manages to be an environment that suggests breakouts are possible while also signaling that there is poor preparation which can fuel panicked reposition when such events do occur.
Chart of DXY Dollar Index and Aggregate Volatility Reading for EURUSD, GBPUSD, USDJPY (Daily)
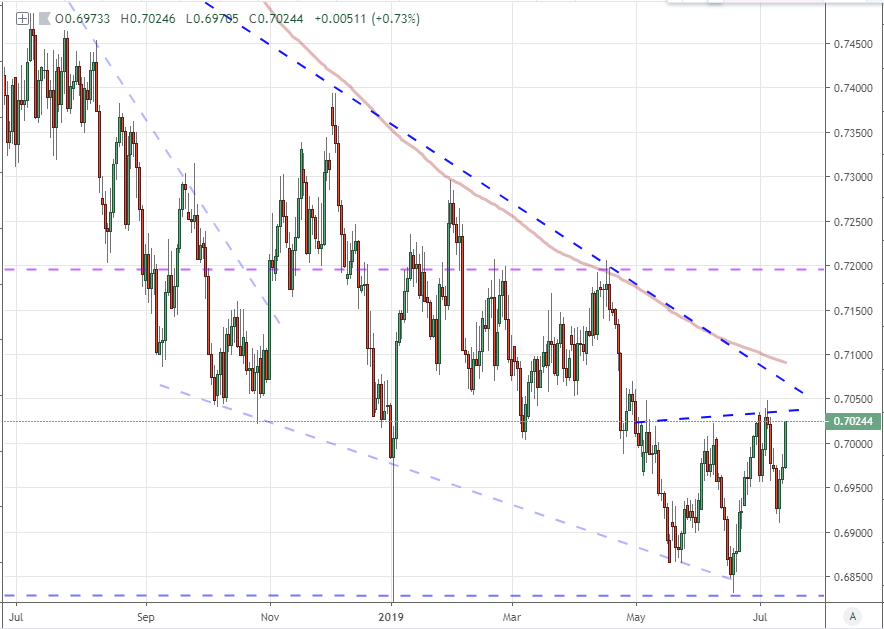
Among the majors, EURUSD is well within its range (similar to the DXY) and GBPUSD is a graveyard of broken technical patterns. It is best to look for those pairs that confirm to general conditions, but I am still keeping an eye on those pairs with medium-term appeal – the systemic transition will eventually occur and it is better to have an option to pursue when it does. The pair that is in the best position should the winds change is AUDUSD. It is closing in on the 200-day moving average, 13-month trend channel resistance and a possible neckline on an inverse head-and-shoulders pattern (sound familiar) near 0.7050.
Chart of AUDUSD (Daily)
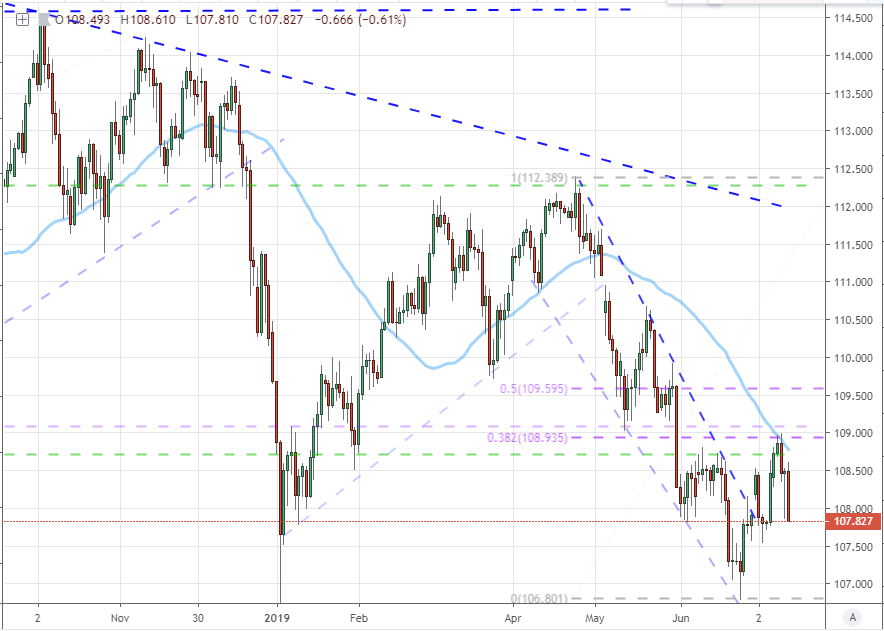
More practical in the event that the markets hold to their more restrained habits is a pair like the USDJPY. While we could consider a pair like EURUSD, USDCHF or NZDUSD which are all technically within their ranges; the USDJPY has more exaggerated examples of near-term support and resistance to jump to between the periods of quiet. It should be noted though that the pair’s restraint through periods recently has been even more extreme than what the Greenback itself has signaled.
Chart of USDJPY and 100-Day Moving Average (Daily)
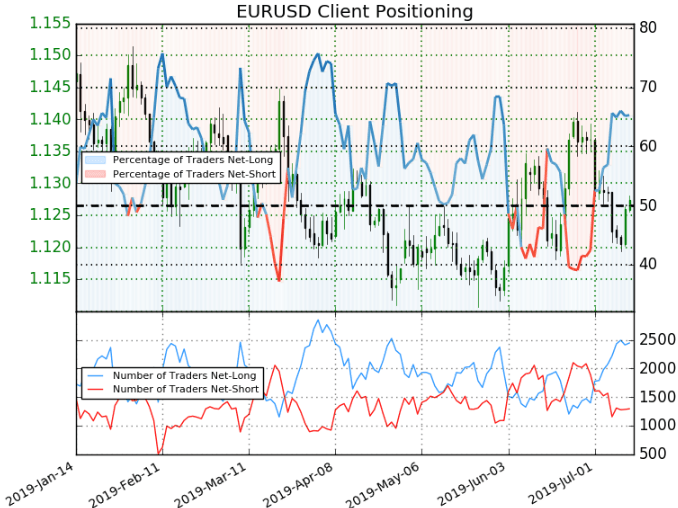
From a speculative positioning perspective, the longer-duration group measured in futures through the Commitment of Traders (COT) report shows a more concerted effort to deleverage the build up in net long exposure that started with the wave back in the second quarter of 2018. The net long exposure behind the Greenback from these futures traders has dropped to its lowest level since June of last year. On the short end of the trader spectrum, retail traders are building up an aggressive anti-trend position for pairs like GBPUSD and USDCAD, but the bulk of liquidity is committing to congestion on the months of chop behind EURUSD.
Chart of Net Speculative Positioning in Aggregate Dollar Futures from CFTC Report (Weekly)
Chart of Retail Trader Positioning from IG Clients (Daily)