


S&P 500, DAX Analysis and News
- Dow Jones| Longest Losing Weekly Streak in 8 years
- FTSE 100 | Key Fib Keeps the Index Above 7200
- DAX | 12000 Break May Pave the Way for Further Losses
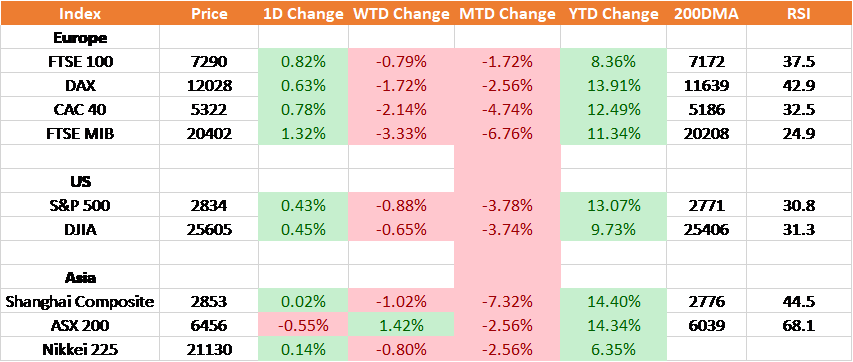
Source: Thomson Reuters, DailyFX
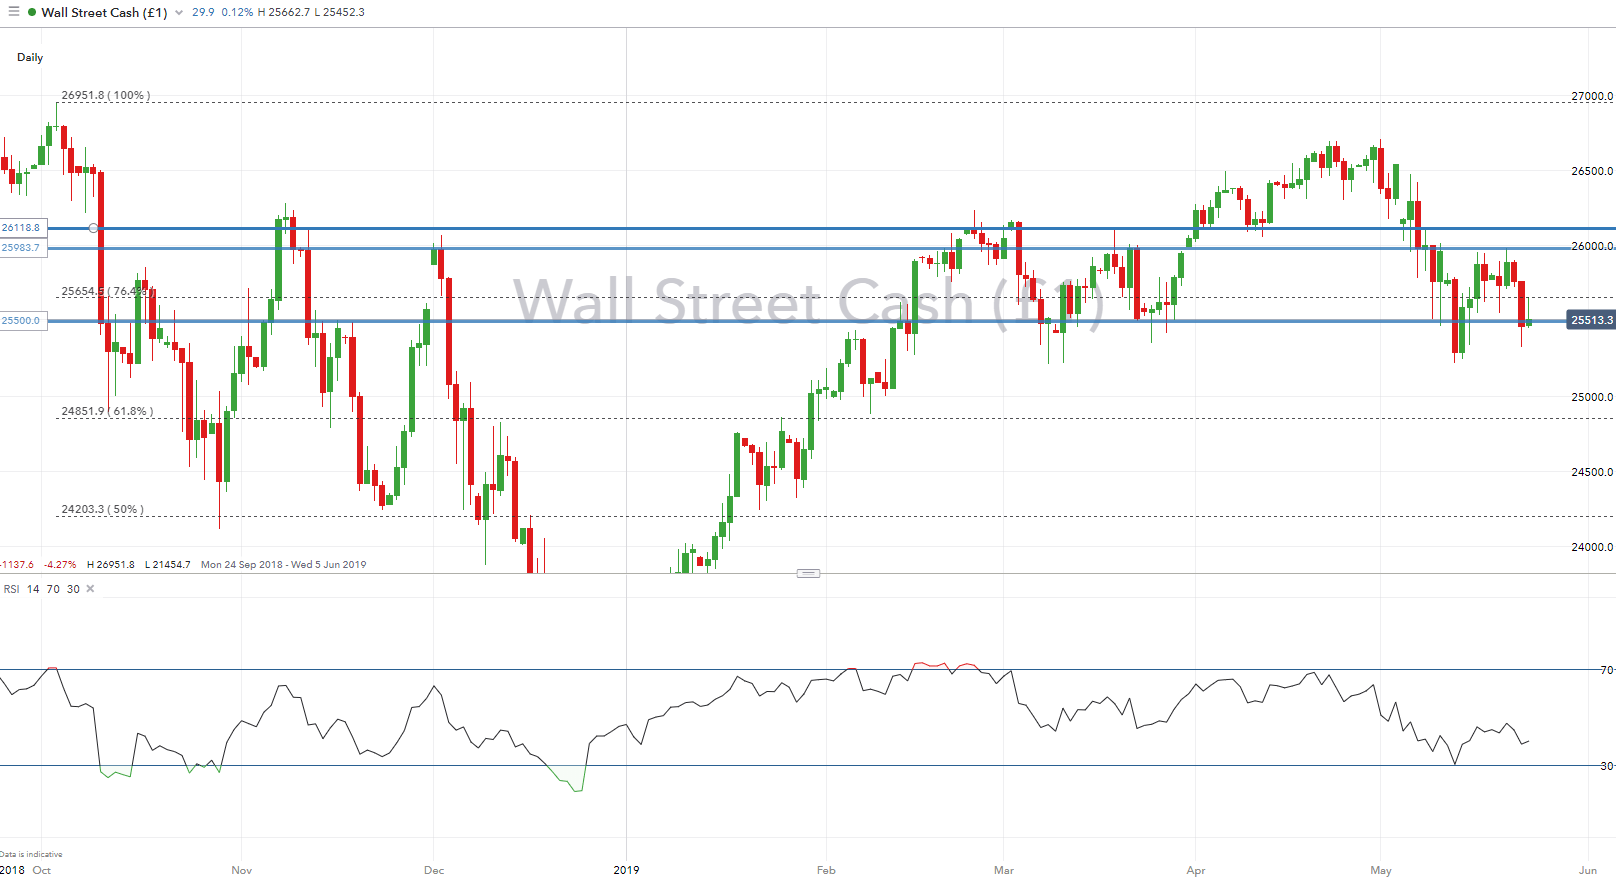
Dow Jones| Longest Losing Weekly Streak in 8 years
The Dow Jones looks set for the longest weekly losing streak in 8 years (5th consecutive week). As it stands, the outlook is relatively weak for the Dow Jones, does a close below 25500 could see losses extend towards the 25000 level. To negate the bearish momentum, eyes will be on for a break above 25700, which opens up the doors for 26100.
Dow Jones Price Chart: Daily Time Frame (Sep 2018 – May 2019)
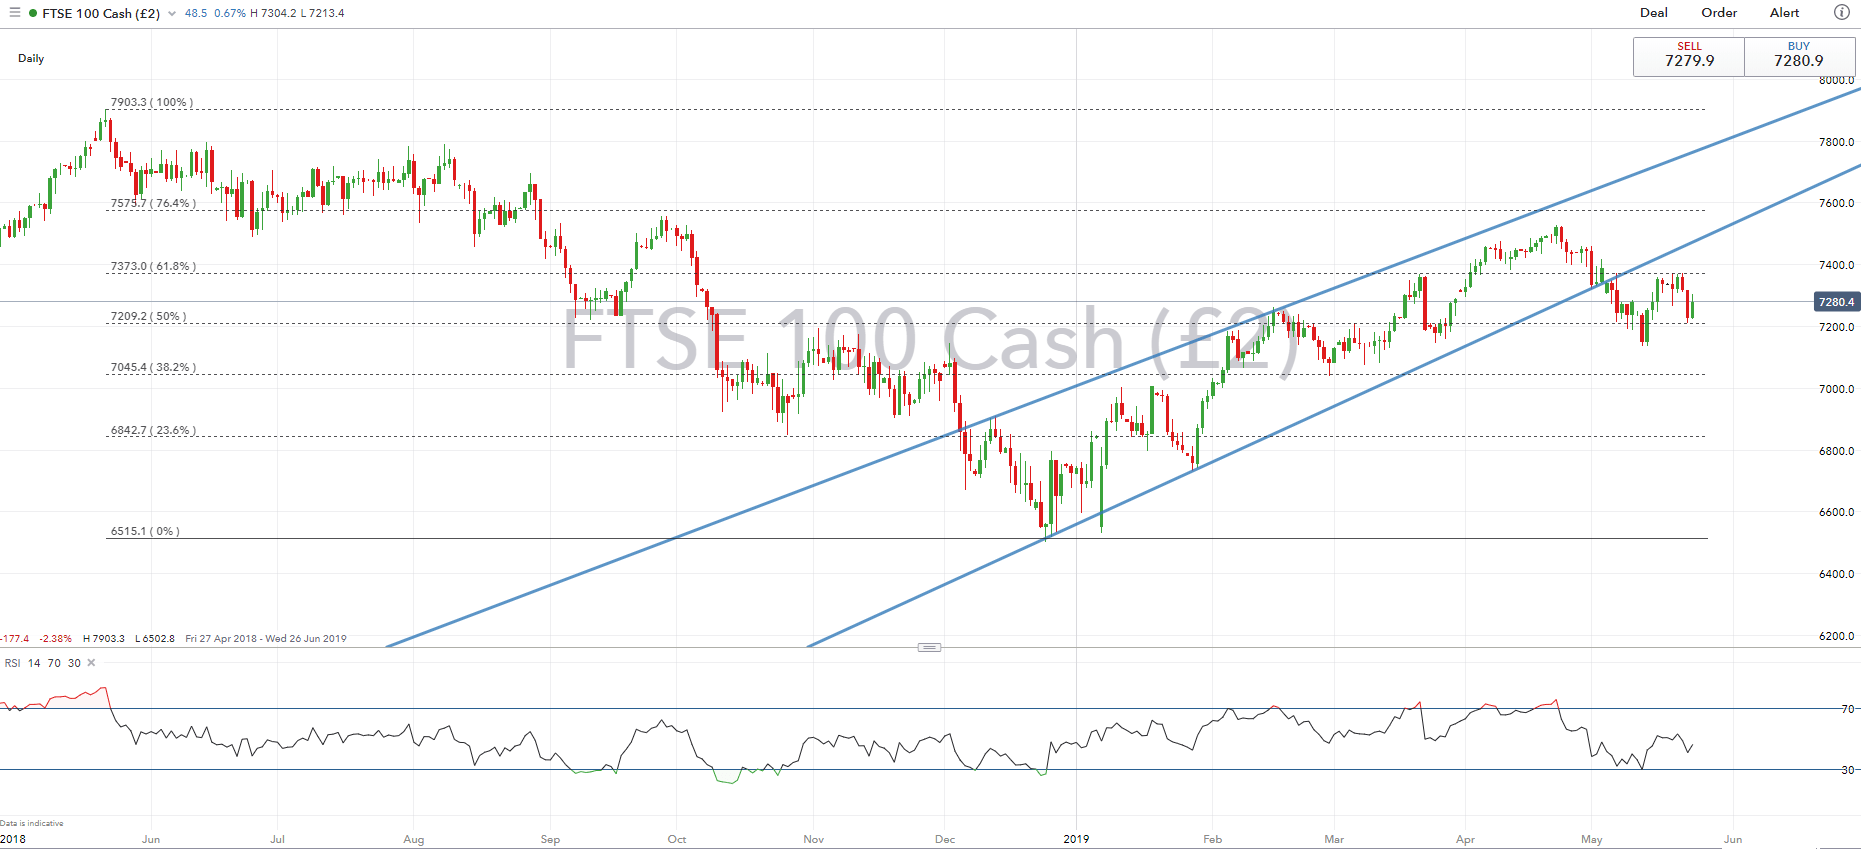
FTSE 100 | Key Fib Keeps the Index Above 7200
Marginal losses for the FTSE 100 as the decline in the Pound kept the index afloat. The key fib leve situated at 7200 remains pivotal for the index, which has held firm thus far. On the topside, a break above 7400 is needed to ease the bearish momentum. Given that next week will likely get of to a quiet start, the index could be somewhat rangebound.
FTSE 100 Price Chart: Daily Time Frame (Apr 18 – Jun 19)
DAX | 12000 Break May Pave the Way for Further Losses
Despite the DAX closing lower by 1.5% for the week, the index has managed to remain in an uptrend, hugging the trendline support from the 2018 low. However, failure to hold above 12000 could see support zone tested at 11800. For the softer outlook to fade a closing break above 12300 is needed. Reminder, given market holidays on Monday, volumes will most likely be lighter thus markets may be vulnerable to overextended moves.
DAX Price Chart: Daily Time Frame (Oct 2017 – May 2019)

RESOURCES FOR FOREX & CFD TRADERS
Whether you are a new or experienced trader, we have several resources available to help you; indicator for tracking trader sentiment, quarterly trading forecasts, analytical and educational webinars held daily, trading guides to help you improve trading performance, and one specifically for those who are new to forex.
--- Written by Justin McQueen, Market Analyst
To contact Justin, email him at Justin.mcqueen@ig.com
Follow Justin on Twitter @JMcQueenFX


