


Gold Technical Forecast - Talking Points:
- Gold retreated from its highest level since April 2018 as bulls lost enthusiasm
- XAUUSD could come under additional pressure after falling below $1,300 price support if the break does not reverse higher quickly
- New to trading gold? Check out the Top Gold Trading Strategies and Tips here. You can also download the free DailyFX Gold Forecast here for our comprehensive outlook
The price of gold was smacked down nearly 3 percent this past week from $1,330 to $1,293. Higher interest rate expectations and tame inflation are probable culprits for the selling pressure seeing that both tend to have negative effects on XAUUSD.
GOLD (XAUUSD) PRICE CHART: WEEKLY TIME FRAME (NOVEMBER 16, 2015 TO MARCH 01, 2019)

From a technical perspective, gold was likely due for a noticeable pullback judging by the red-hot relative strength index (RSI). The RSI has been increasingly sending an ‘overbought’ signal due to the 13 percent runup in the commodity since bottoming August of last year. As such, the selling in gold could be viewed as a healthy ‘reversion to the mean’ with prices consolidating back towards its moving average.
Although, gold bulls were likely disappointed after the 0.786 Fibonacci retracement line – which rests around the psychological $1,300 support level – did not hold with prices breaking below this consolidation area. This may have soured sentiment further and induced additional selling as short-term momentum traders react to the apparent end of gold’s parabolic ascent.
On a more positive note, however, upward trendline support extended from where XAUUSD prices bottomed in December 2015 and December 2017 is a noteworthy level for prices to rebound higher.
GOLD (XAUUSD) PRICE CHART: 4-HOUR TIME FRAME (JANUARY 23, 2019 TO MARCH 01, 2019)
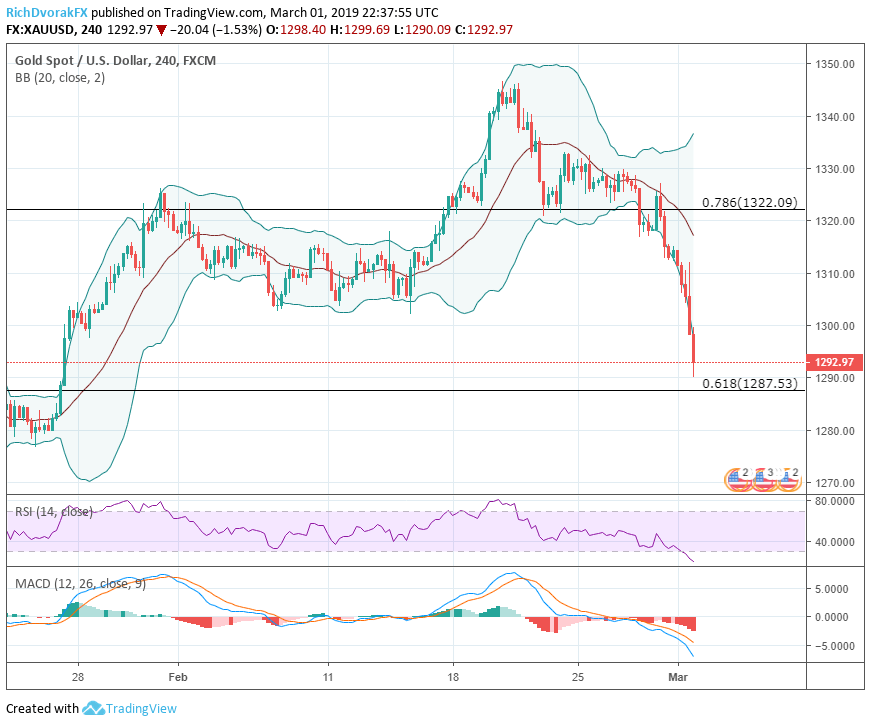
Honing in on a closer time frame, it becomes clear how dramatic this week’s selloff was. The 4-hour chart shows that the RSI is now extended well into ‘oversold’ territory with spot prices not far from Fibonacci support at the $1,290 area. If gold fails to catch bid and find support soon, XAUUSD may quickly fall out of favor and exacerbate recent weakness which could push downside targets below $1,280.
That being said, renewed global growth fears or fleeting optimism from risk assets could resurface at any time as recent data indicates the world economy is still struggling to keep its footing. If this materializes as it did towards the end of last quarter, financial conditions would likely tighten again and push investors abandoning risk assets back into gold.
---
Written by Rich Dvorak, Junior Analyst for DailyFX
Follow on Twitter @RichDvorakFX


