


GBPUSD Technical Analysis
- Triangle breakout on the four-hour chart nears.
- Daily chart signals a re-test of the recent low.
We have recently released our Q4 Trading Forecasts for a wide range of Currencies and Commodities, including GBPUSD with our fundamental and medium-term term technical outlook.
GBPUSD – Short-term Breakout Nears
GBPUSD is currently rangebound and stuck within a triangle, pointing to a breakout in the short-term, and the downside looks more likely in the current environment. The pair are currently trading above the 20- and 50-day moving average, but any upside momentum is going to find resistance around 1.2800 – 1.2820. Sterling bulls may point to the recent higher lows being made as a sign of strength but a break below 1.2730 would negate this and leave the pair vulnerable to further falls with the recent multi-month low at 1.2658 the first target.
GBPUSD Four-Hour Price Chart December 7, 2018

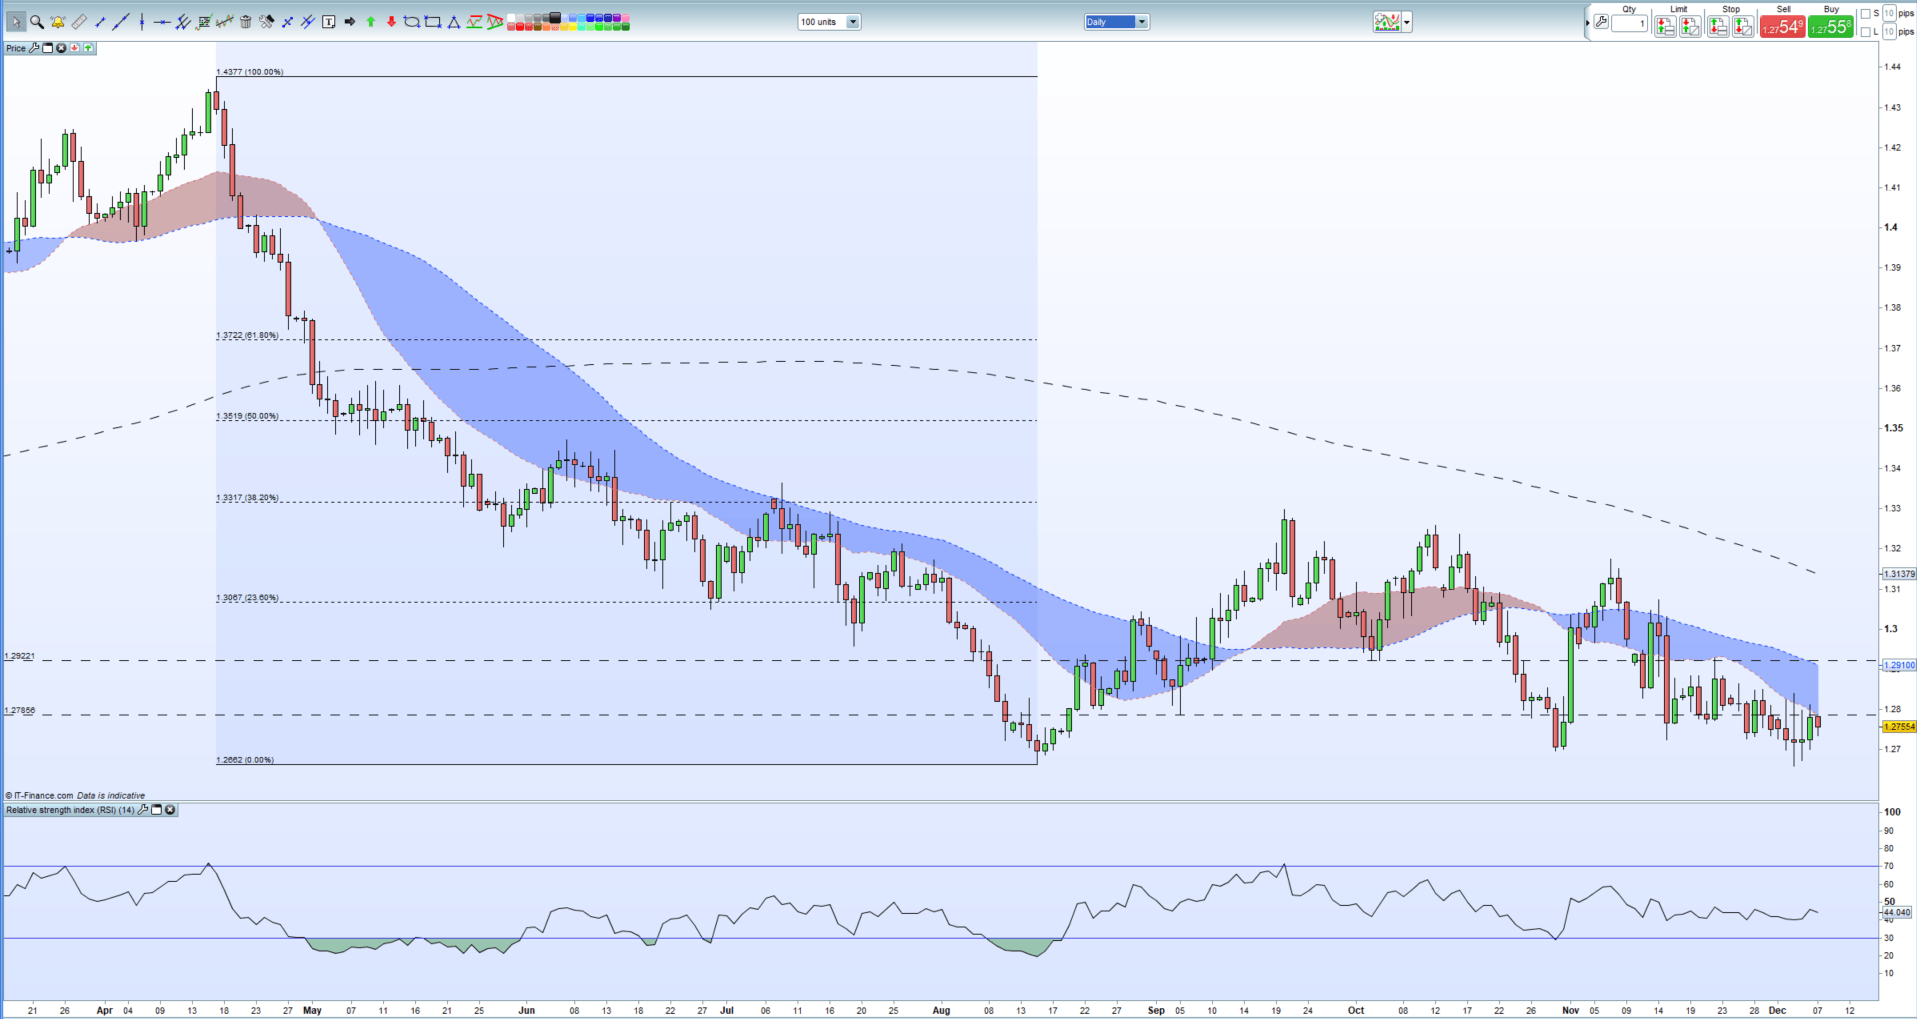
The daily GBPUSD chart paints a slightly different picture with lower highs dominating. The pair also trade below all three moving averages, with the 20 and 50-day mas providing resistance all the way back up to 1.2822. A break and close below the October 30 low at 1.2694 leaves 1.2658 vulnerable for a re-test.
GBPUSD Daily Price Chart December 7, 2018
While the technical outlook may point to lower prices, the IG Retail Sentiment Indicator is suggesting that GBPUSD may move higher. Traders are 63.1% net-long GBPUSD – a bearish contrarian indicator – yet traders are less net-long than yesteday and compared with last week. This suggets that GBPUSD may move higher despite the fact that traders are net-long.
--- Written by Nick Cawley, Analyst
To contact Nick, email him at nicholas.cawley@ig.com
Follow Nick on Twitter @nickcawley1
Other Weekly Technical Forecast:
Australian Dollar Forecast – AUD/USD, AUD/JPY and EUR/AUD Trend Lines Broken


