


-- Subscribe to Jamie Saettele's distribution list in order to receive a free report to your inbox several times a week.
--Looking for ideas and forecasts? Visit the DailyFX guides and forecasts page. Also, check out the webinar schedule.
--Are you positioned with the crowd? Check the IG Client Sentiment page to find out.
Weekly (LOG)

Chart Prepared by Jamie Saettele, CMT
See REAL TIME trader positioning
I’ve noted long term EUR/USD bottoming conditions recently such as the key reversal in January, divergence with RSI (monthly and weekly) and the channeling decline. However, the follow through on the weekly outside reversal doesn’t exactly inspire confidence in near term (at least) upside. What’s more, the rally from January is left as a 3 wave advance at this point and ‘counts’ as a 4th wave within a 5 wave decline from the 2016 high. The implication is that a 5th wave lower is underway to at least 1.0200 (measured target based on wave 1 = wave 5). 1.0900 is the pivot (where things change).
Weekly
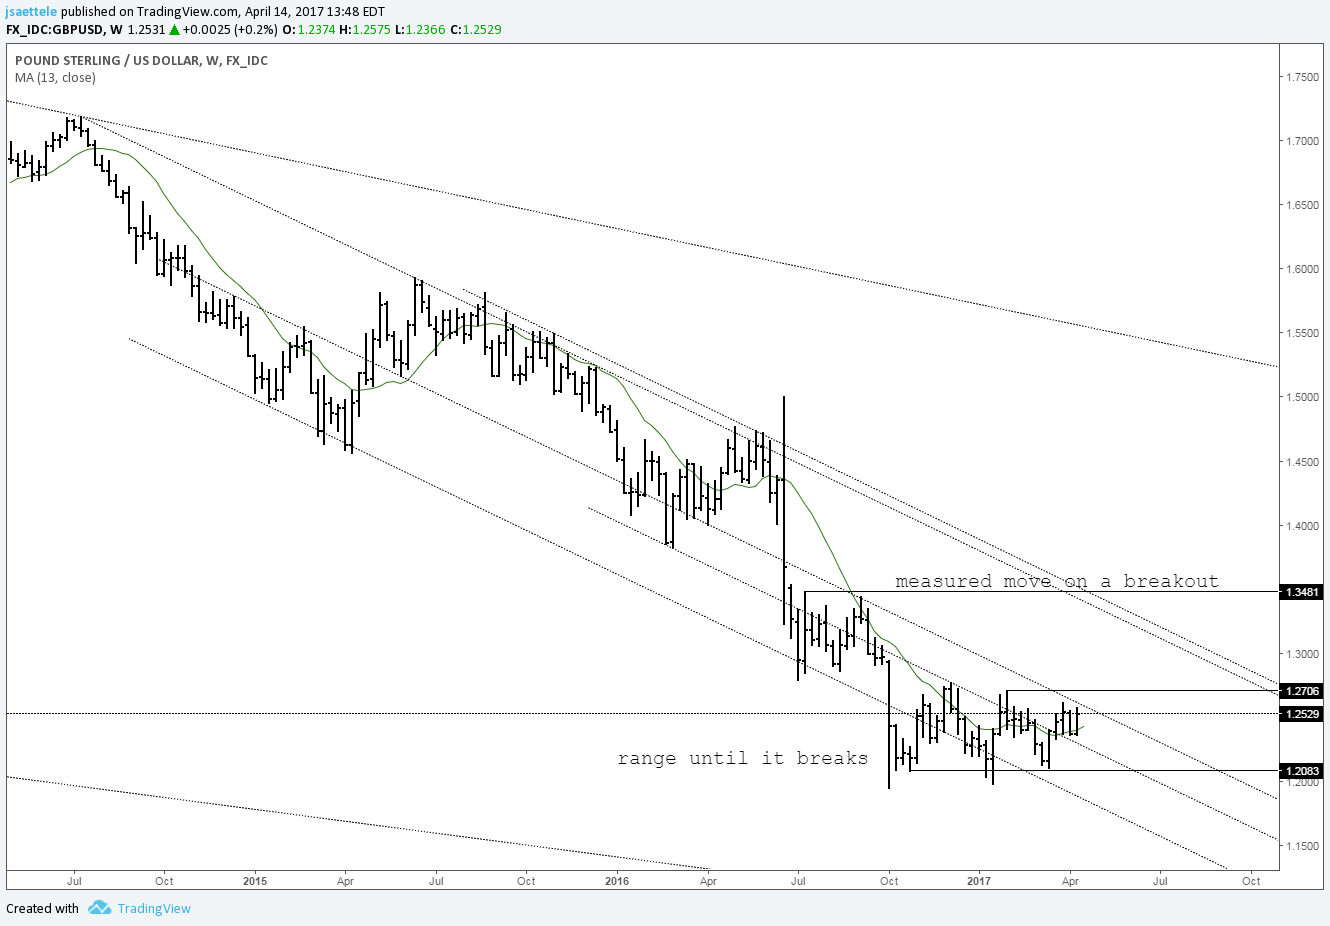
Chart Prepared by Jamie Saettele, CMT
See REAL TIME trader positioning
GBP/USD has been trading sideways since the October crash in what may be a triangle. The end of the quarterly declines mentioned last week shouldn’t be forgotten however. “For the 3rd time in history, a string of 6 consecutive down quarters has ended. The prior to instances were major lows but also resolved with clean quarterly reversal candles. Q1 just carved an inside bar.” As such, I’m still open to both sides within the range and must acknowledge the possibility of an A-triangle B scenario from the October low.
Weekly
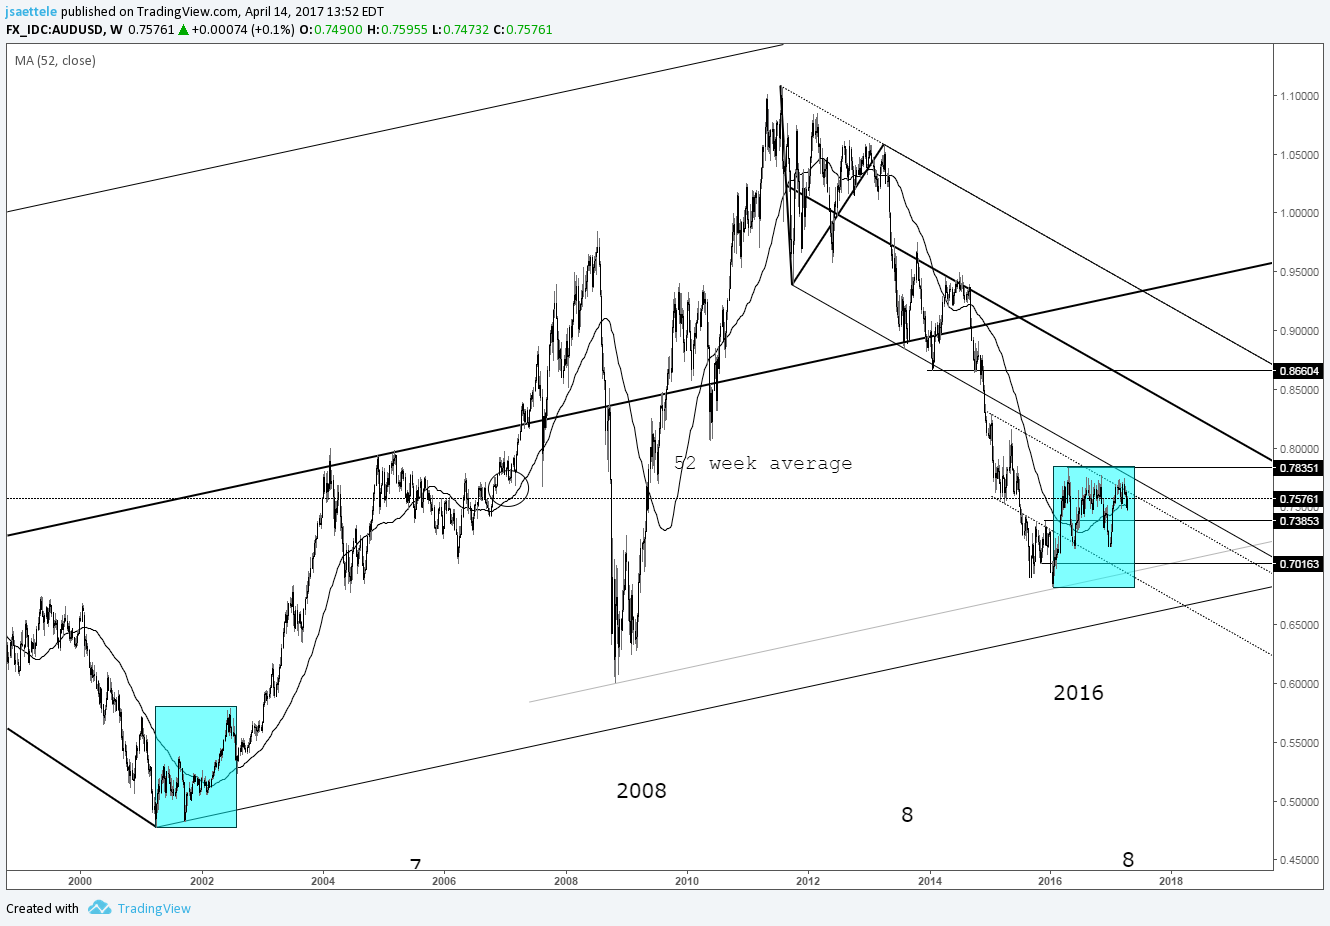
Chart Prepared by Jamie Saettele, CMT
See REAL TIME trader positioning
Every AUD/USD poke into .7700-.7800 over the last year has failed. The main consideration for resistance up there are from parallels. As long as price is below the parallel, longs are fighting an uphill battle. After the February top, I noted that “the dip could extend to the October and December 2015 highs at .7385.” That level is in play barring a breakout through the top of the range. I’ll note that 65 weeks have passed since the January 2016 low. The final low within the bottoming sequence in the early 2000s was 70 weeks from the initial low. Momentum is much weaker now than it was then but the timing is interesting.
NZD/USD
Weekly
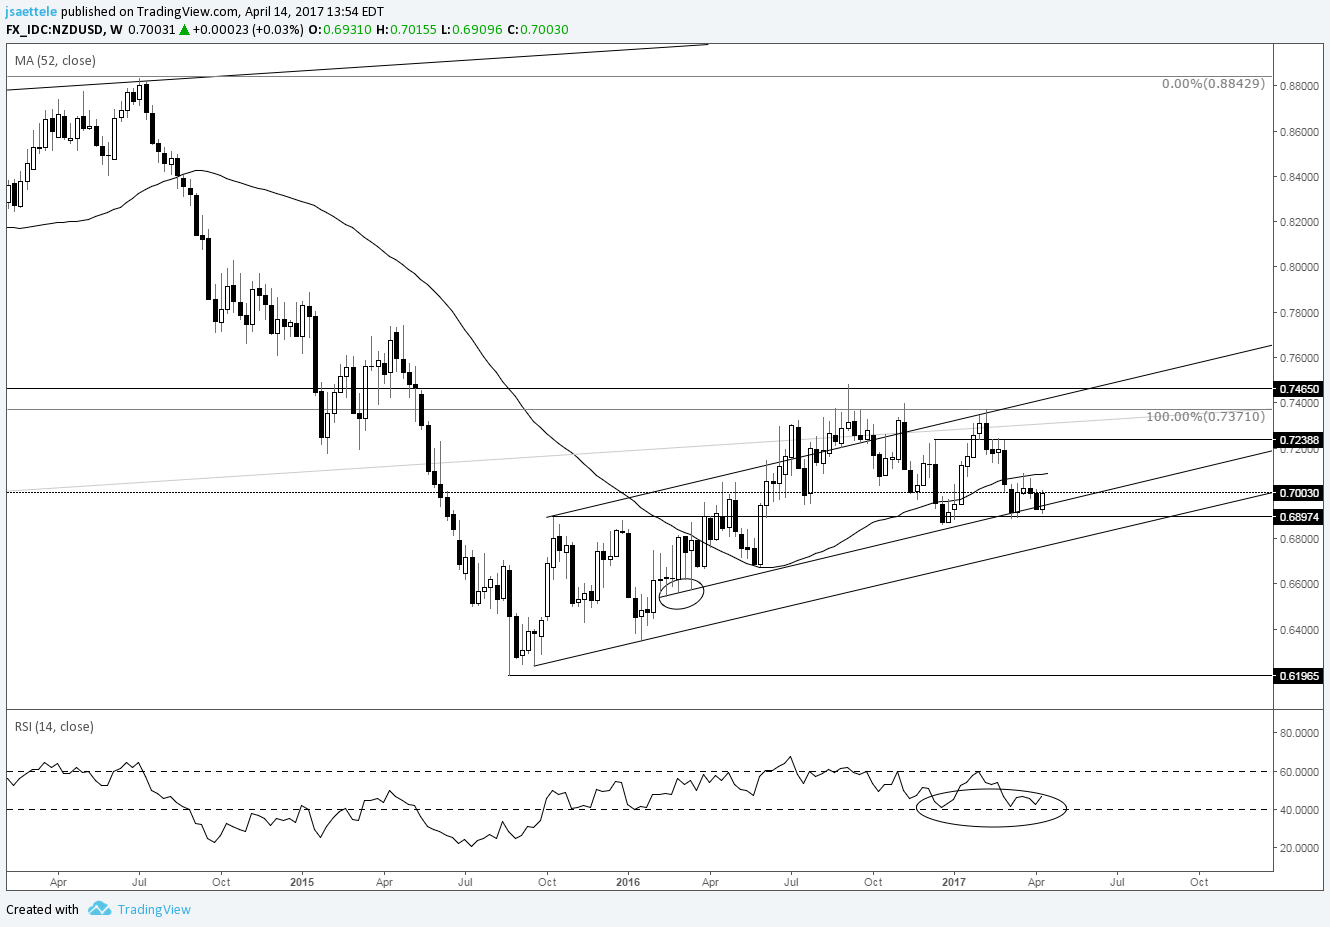
Chart Prepared by Jamie Saettele, CMT
See REAL TIME trader positioning
Don’t forget about the 2015-2016 trendline just below .6800 in Kiwi. Bigger picture, I’m still lost. Is the rally from August 2015 countertrend or a new trend? The 2016 and YTD highs are at major resistance from the 2011 low and a double top target is still unmet at .5899. A break under the 2015-2016 trendline would suggest a good deal more downside. Until then, keep an open mind. It’s possible that Kiwi could work higher now as price has responded to a parallel 4 of the last 6 weeks.
USD/JPY
Weekly

Chart Prepared by Jamie Saettele, CMT
See REAL TIME trader positioning
The following was put forth in the USD/JPY Q2 forecast. “A major USD/JPY level could be met in April. The 52 week average (support and resistance for years) is near 108.30 and the 50% retracement of the decline is at 108.81 (the 1991 high was a 50% retracement of the 1990 decline by the way). The decline from the January high would consist of 2 equal legs at 108.49. This zone (108.30/81) intersects with the developing channel from the January high in mid-April.” The level has been met but there is gap risk now as per median line guidelines. Watch this video for details.
Weekly

Chart Prepared by Jamie Saettele, CMT
See REAL TIME trader positioning
There is no change to the USD/CAD weekly comments, which continues to tread water under range highs. “The USD/CAD rally from May 2016 is corrective so the bias is for impulsive weakness but the proximity of a long term parallel to the December high increases risk of a bull trap on a push through the horizontal level (failed breakout). However, the March high is a few ticks below the 52 week closing high so it’s possible that USD/CAD is ready for its next leg lower. Weekly RSI has been failing near 40 since late 2016 which is bearish behavior.”
Weekly
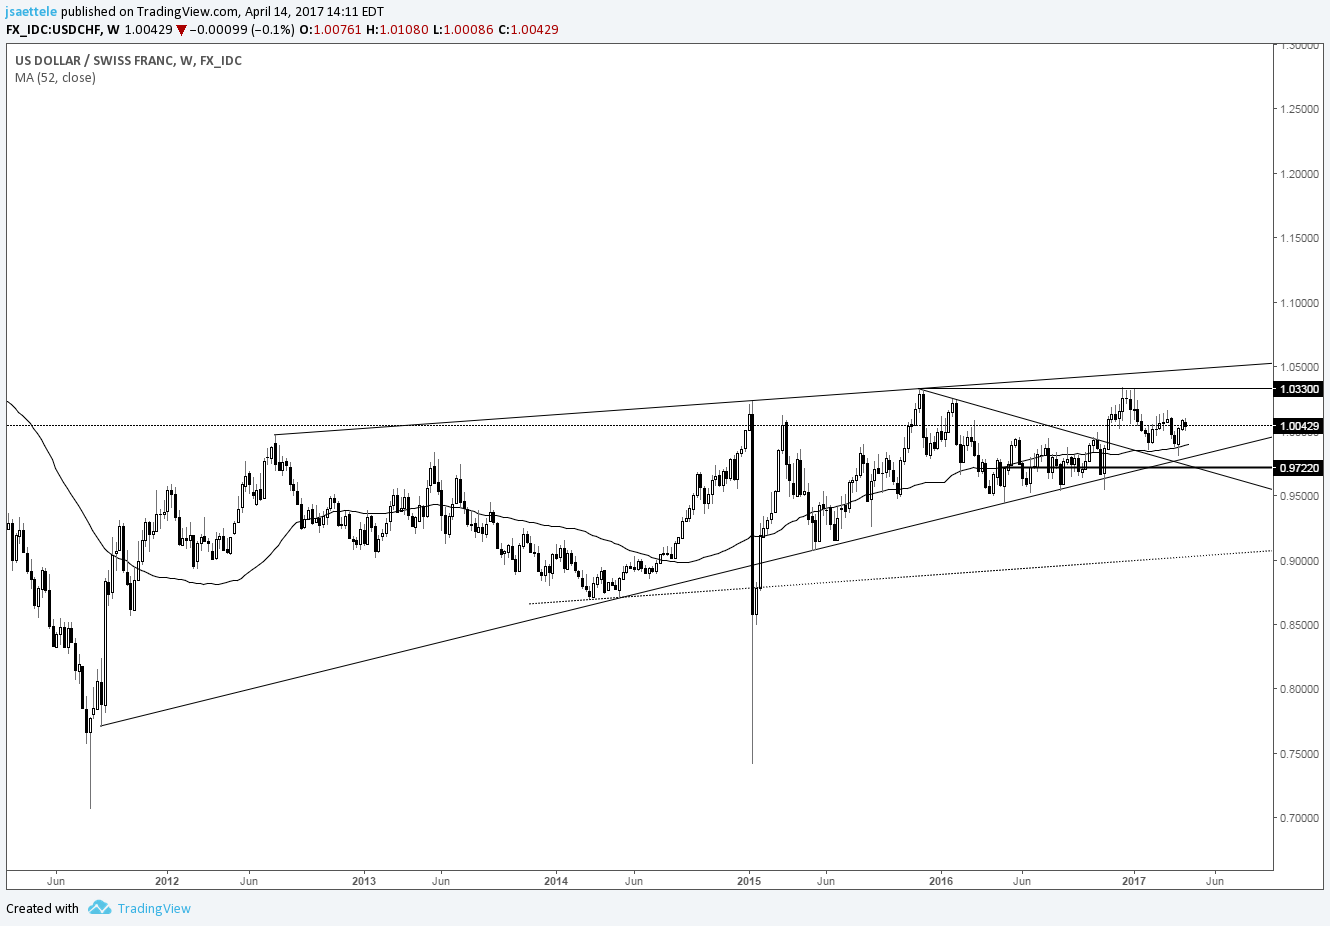
Chart Prepared by Jamie Saettele, CMT
See REAL TIME trader positioning
My USD/CHF focus has been on the trendline that originates at the September 2011 low. The line has been support on every touch since 2015 (including the US election). Of course, the latest dip didn’t even reach the line! Like EUR/USD (inverse), price has followed through on the prior week’s outside reversal. The 55 week average was also support at the low. The bullish outside week and follow through is a great way to begin a directional leg. The line that connects the 2012 and 2015 (twice) highs is resistance just below 1.0500.


