


- EUR/USD huge resistance test-breakout would be significant
- AUD/USD tweezer top pattern
- China stock market not out of the woods yet
-- Subscribe to Jamie Saettele's distribution list in order to receive a free report to your inbox several times a week.
--For more analysis and trade setups (including current positions and the ‘watchlist’), visit SB Trade Desk
--Free trading tips
Weekly

Chart Prepared by Jamie Saettele, CMT
See REAL TIME trader positioning
-The importance of the current juncture in EUR/USD cannot be understated. If resistance from a parallel (August high) and horizontal levels gives way, then EUR/USD could trade to the mid-1.20s, and maybe quickly given that the rate had held a 3+ decade trendline for over a year. Also, this week’s range is the smallest since late December 2014 (Christmas holiday). The week’s range is the smallest non-holiday range since the 2nd week of September 2012. Narrow range bars can provide useful reference points but markets also sometimes go ‘quiet’ before strong moves.
-For forecasts and 2016 opportunities, check out the DailyFX Trading Guides.
Weekly
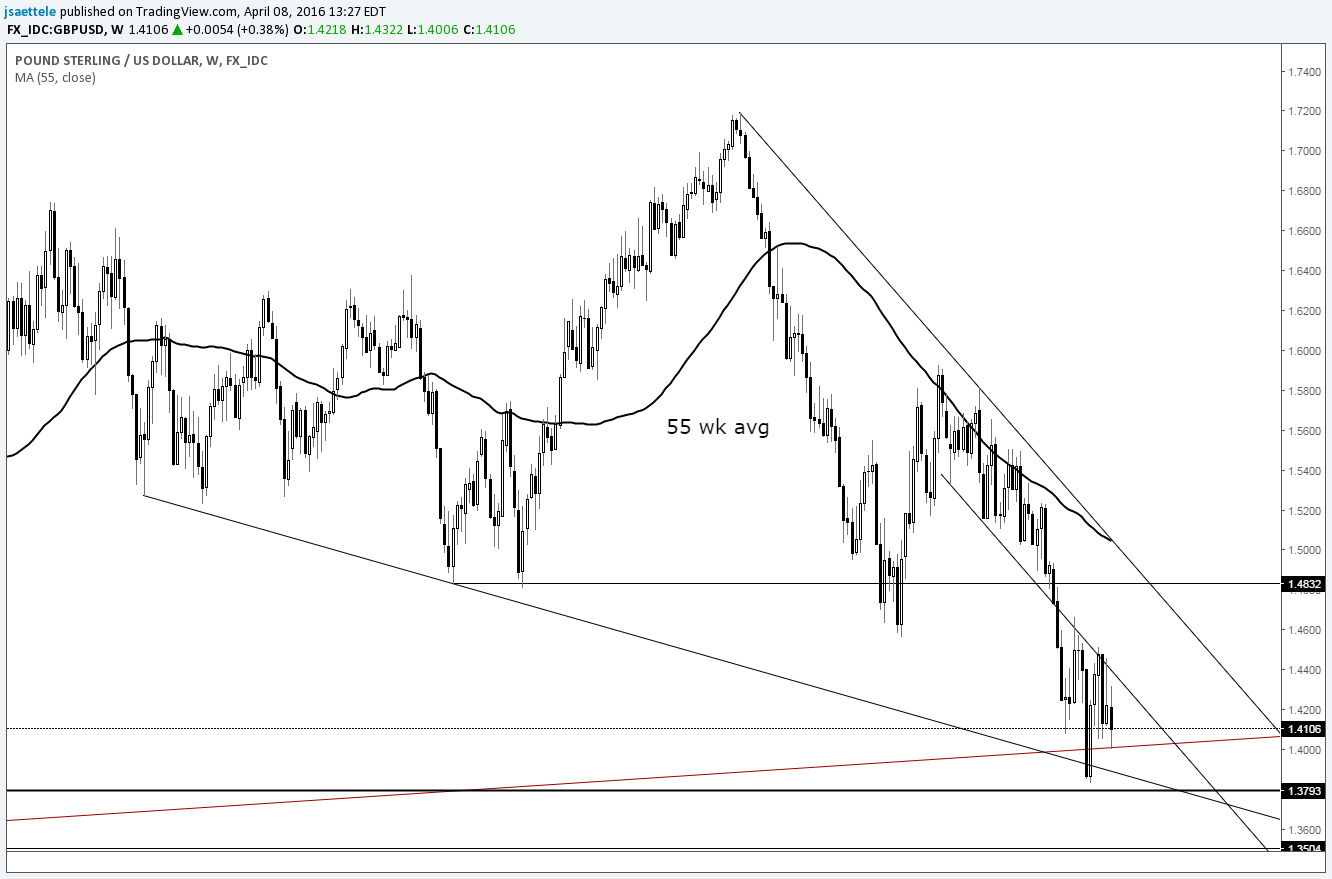
Chart Prepared by Jamie Saettele, CMT
See REAL TIME trader positioning
-There is no change to weekly GBP/USD comments. “Recent price action formed a ‘tweezer bottom’ candlestick formation (FXTW pointed out tweezer bottoms in AUD/USD at the September and January lows). This is a reversal pattern. The fact that the pattern formed amid the chaos of headlines (sentiment extreme on ‘BREXIT’) and at a confluence of trendlines indicates increased risk for a decent sized bounce. General focus is higher, probably until the low 1.50s, although continued failure at an internal trendline is a concern. A crash could then take place into early 2017, based on a 96 month (8 year) cycle low count.”
AUD/USD
Weekly

Chart Prepared by Jamie Saettele, CMT
See REAL TIME trader positioning
-FXTW was looking for resistance in AUD/USD from the October 2013-January 2014 line near .7800. That level has not been reached and a tweezer top (candlestick pattern…tweezer bottoms identified the lows in September 2015 and January) warns that it may not be reached. Also, risk of a top is heightened given COT considerations. Don’t forget about the cyclical influence next week…
-“The 2nd week of April is lining up as a potentially important pivot in time. The 1993 and 2001 lows (latter is the all-time low) are exactly 392 weeks apart. 392 weeks from the 2001 low is the week of the October 2008 crash (the low was 3 weeks later). 392 weeks from the October 2008 crash is the week of April 11th. My colleague Kristian Kerr, whose cycle work is a must read, often stresses the importance of what a market is doing into a time window. In other words, a high/low could form if the market is heading into resistance/support within the window (and if other conditions are met of course). Also, a break of a key level during this time would warn of possible acceleration in the same direction. Context is key (always is). For now, just know that the week of April 11th is a big point on the X-Axis for Aussie.”
Weekly
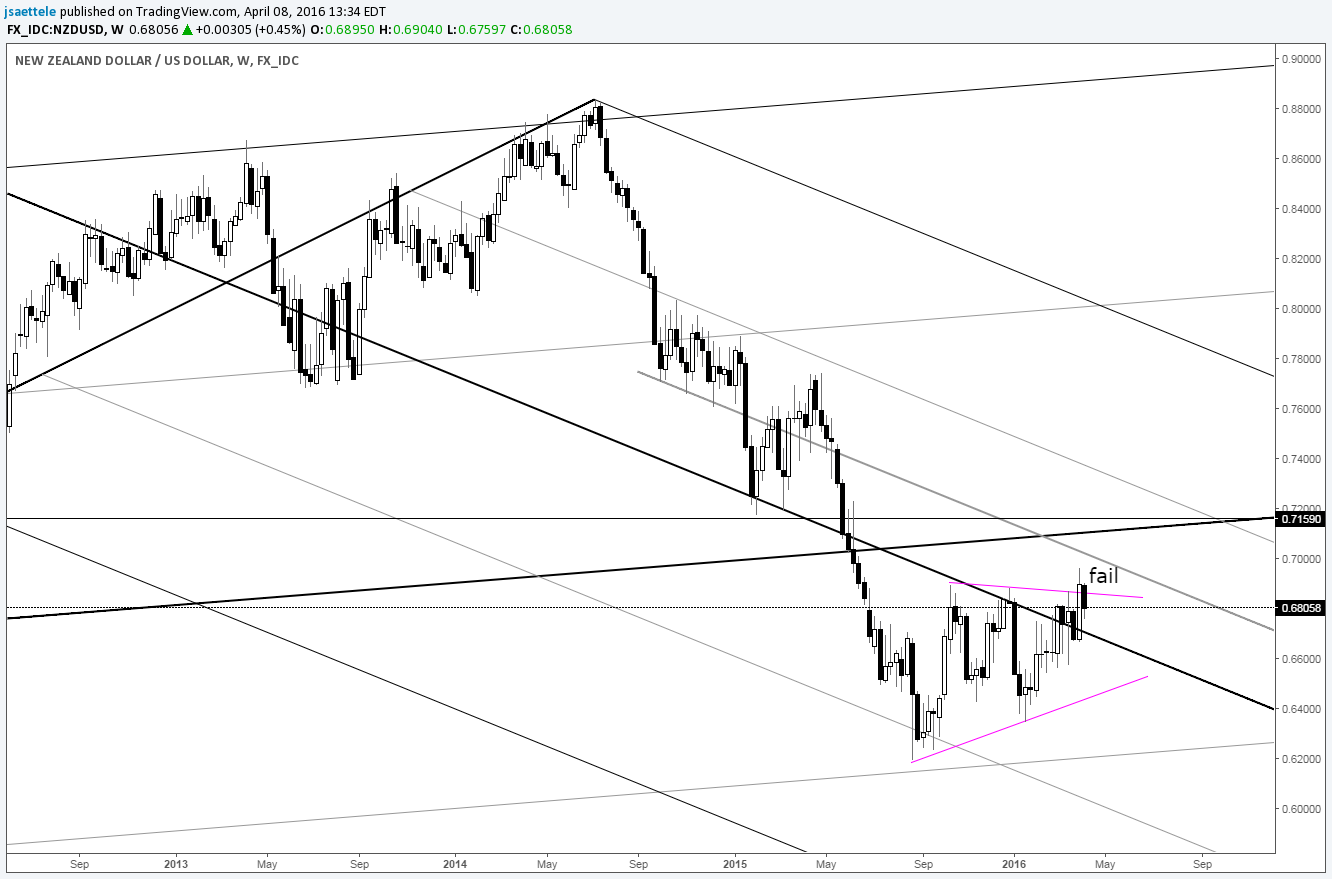
Chart Prepared by Jamie Saettele, CMT
See REAL TIME trader positioning
-FXTW wrote last week that “NZD/USD is attempting to break out from a 7 month ascending triangle pattern. The objective from the pattern is mid .7400s although FXTW believes that .71-.72 (2011 low and February 2015 low) is important and could influence for another leg lower.” The same levels remain of interest for NZD/USD but the inability of NZD/USD to follow through this week casts doubt on the immediate bullish prospects. It’s possible that a failed pattern ends up triggering another bear leg.
Weekly

Chart Prepared by Jamie Saettele, CMT
See REAL TIME trader positioning
-Recent FXTW comments were that “the head and shoulders target is still in focus near 105, which is near the January 2014 high and October 2014 low, but it could be a while before that is reached. Don’t overlook the fact that this week’s low is 110.66…or 1 pip from the 2008 high. A parallel to the 1990-1998 line, extended from the 2007 high, is also at the low (this angle was also the neckline from the 2010-2012 inverse head and shoulders that launched the rally into last summer. Generally speaking, USD/JPY could hold up for a while longer.” USD/JPY broke down this week, proving wrong my suspicions that the rate would hold up a while longer. There are a host of technical considerations for support between roughly 105 and 106, including the 2002-2007 line, January 2014 high, and October 2014 low.
Weekly

Chart Prepared by Jamie Saettele, CMT
See REAL TIME trader positioning
-There is no change to recent USD/CAD comments. “USD/CAD 1.30 has been reached so it may be time to go the other way. Weekly RSI has reached 40 as well, which is often associated with at least near term markets lows. FXTW believes that the broader bull trend has resumed but be aware of 1.3816 as a trading level.”
Weekly

Chart Prepared by Jamie Saettele, CMT
See REAL TIME trader positioning
-USD/CHF is consolidating (perhaps in a wedge from the November high) and there is nothing else to add to previous comments regarding the longer term picture at this time. “Some extremely long term technical considerations are worthy of note when looking at USD/CHF. Read about them here. Long term support is at .9400 (trendline and 200 week average).”
Bonus Charts
FXI (China Large Cap ETF) Weekly

Chart Prepared by Jamie Saettele, CMT
Have we witnessed major lows in AUD/USD, metals, energy (commodities in general), China, etc.? My colleague Kristian Kerr ponders the same question. As it stands now, copper and AUD/USD bottomed the same week that the USDOLLAR index topped (week that ended 1/22) while crude oil and China bottomed 3 weeks later (the week that ended 2/12). My take is that we’ve probably seen turns in some markets/instruments but not all. Divergences measured in months, not weeks, typifies the big turns. The post GFC lows are a great example. AUD/USD and China made lows in October 2008. Treasury bonds peaked in December 2009. Copper made low in January 2009. Crude made low in February 2009 and the USD topped in March 2009 (also the S&P low).
One of the markets that may NOT have made its low yet is China. FXI (China large cap ETF) recently made a price high at former support from a parallel that has proved useful for years. The recent price high of 34.12 is also 2 ticks shy of where FXI opened the year (the ultimate opening range). I wrote about this level as resistance in early March. Near term price action also suggests that bears are not quite ready to go into hibernation. The rally from the 2/11 low consists of 7 waves. In Elliott, 3 wave market movements are viewed as countertrend. Two 3 wave movements equal 7 waves (3+3+1). Weakness from 3/30 to 4/7 consists of 5 waves. Under Elliott, movements in the direction of the broader trend occur in 5 waves. Draw a line over the 3/30 high. Evidence suggests that weakness in China is not yet complete. I’ll reconsider if price exceeds the 3/30 high.
FXI (China Large Cap ETF) Hourly
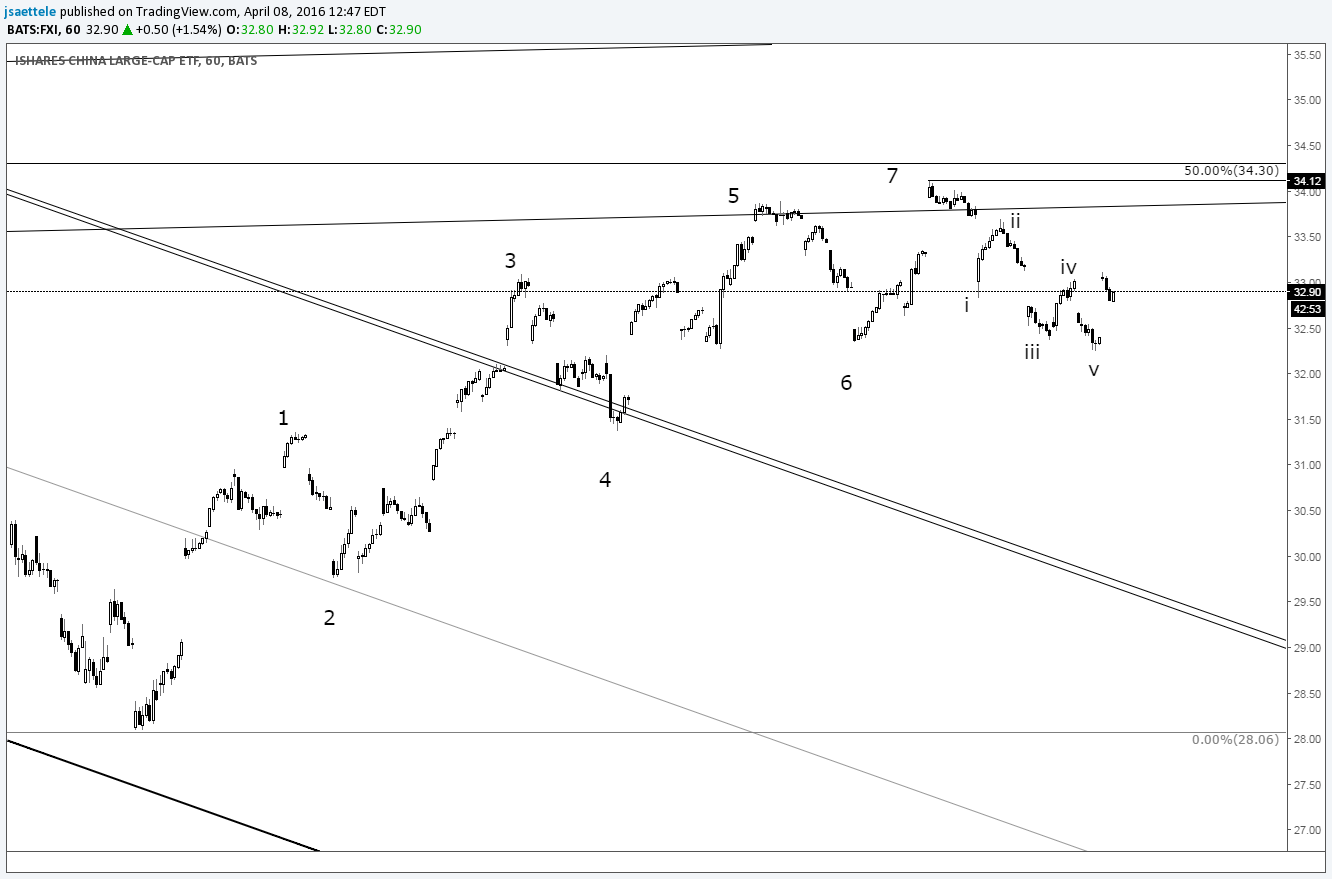
Chart Prepared by Jamie Saettele, CMT


