


-- Subscribe to Jamie Saettele's distribution list in order to receive a free report to your inbox several times a week.
--For more analysis and trade setups (including current positions and the ‘watchlist’), visit SB Trade Desk
Weekly
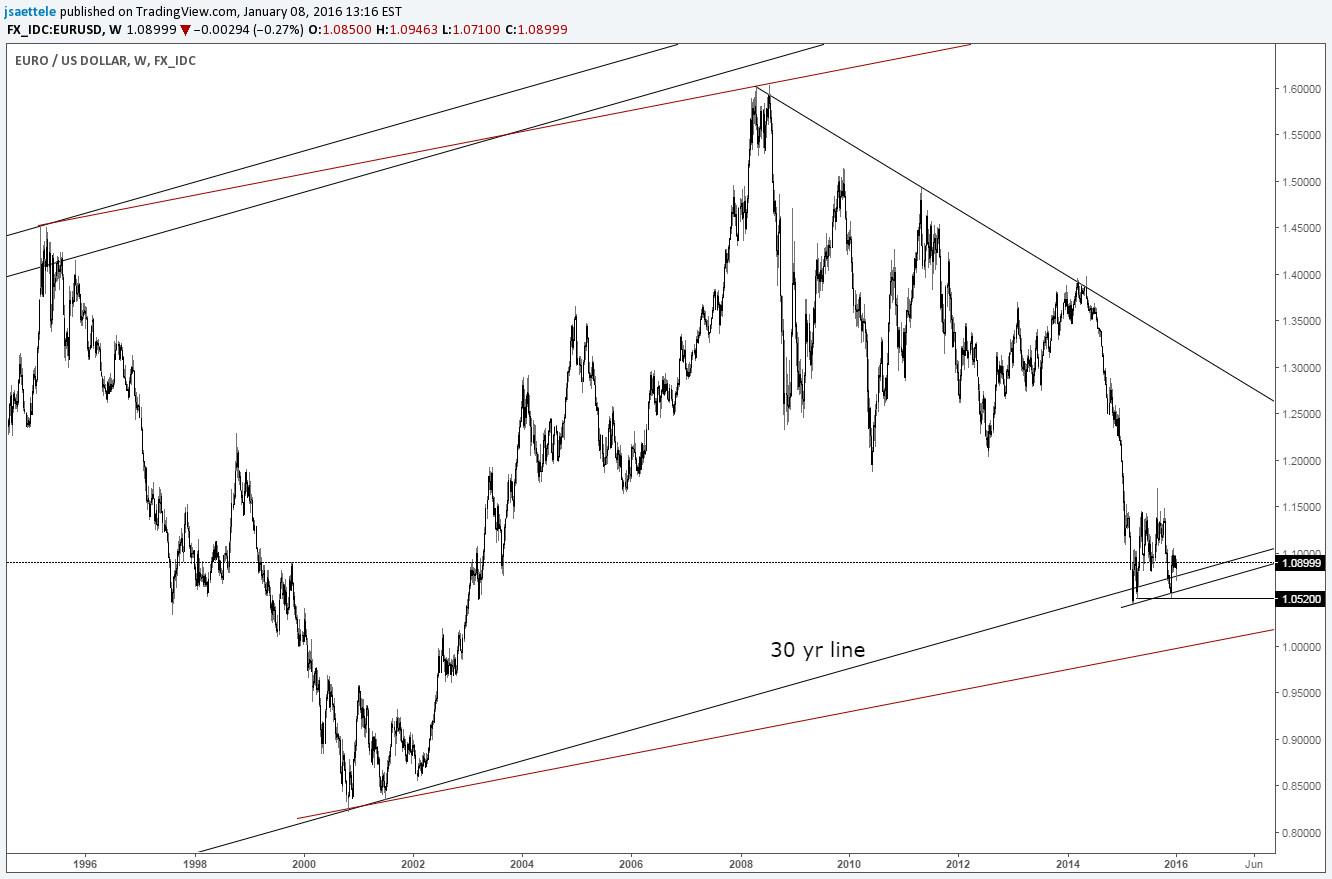
Chart Prepared by Jamie Saettele, CMT
Automate trades with Mirror Trader
-EUR/USD continues to find support along really long term support lines. It remains to be seen of course whether or not price action since March 2015 composes a bullish base that leads to a major reversal or simply consolidation on the way to lower prices. Either way, focus for now is higher given that the mentioned long term support lines. SSI, which is currently negative (and has been for most of the last 5 weeks), supports the long side at this juncture.
Weekly
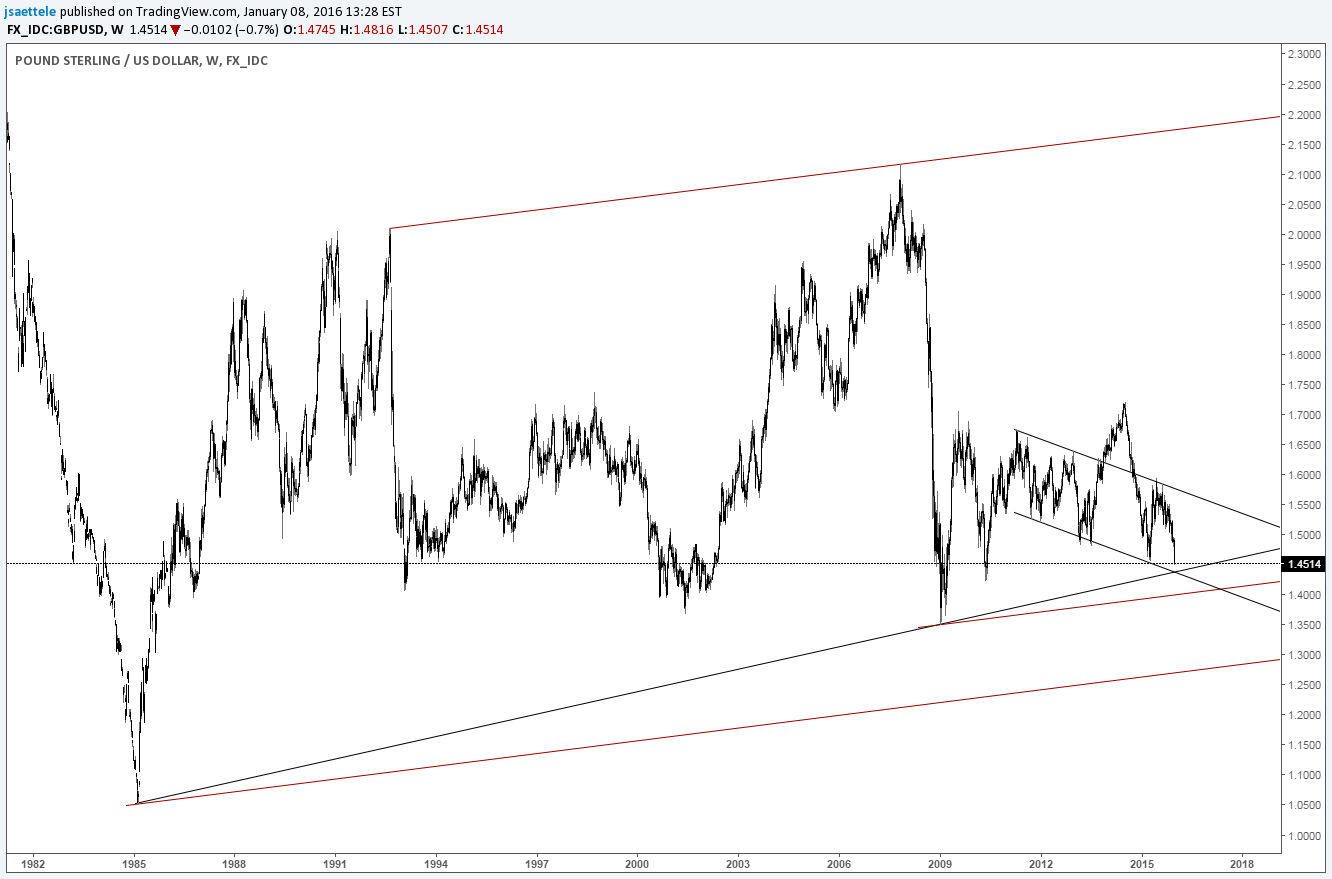
Chart Prepared by Jamie Saettele, CMT
Automate trades with Mirror Trader
-The last FXTW (in early December) was bullish GBP/USD. The note read that “the weekly reversal warrants bullish consideration, especially since this week’s low is at well-defined parallel support.” Since that low gave way, GBP/USD is down almost 400 pips. So, bullish was clearly wrong. It’s ok to be wrong, just use stops. In fact, being wrong is a hallmark of successful traders. Those that can’t be wrong (use stops) get destroyed. Check out our popular Traits of Successful Traders’ series to find out more about what separates the winning traders from the losers. Anyway, GBP/USD is nearing one of the more important junctures in decades (seriously). The line connects the 1985 and 2009 lows is just below the market…as is downtrend support that cuts through lows over the last 4+ years.
AUD/USD
Weekly
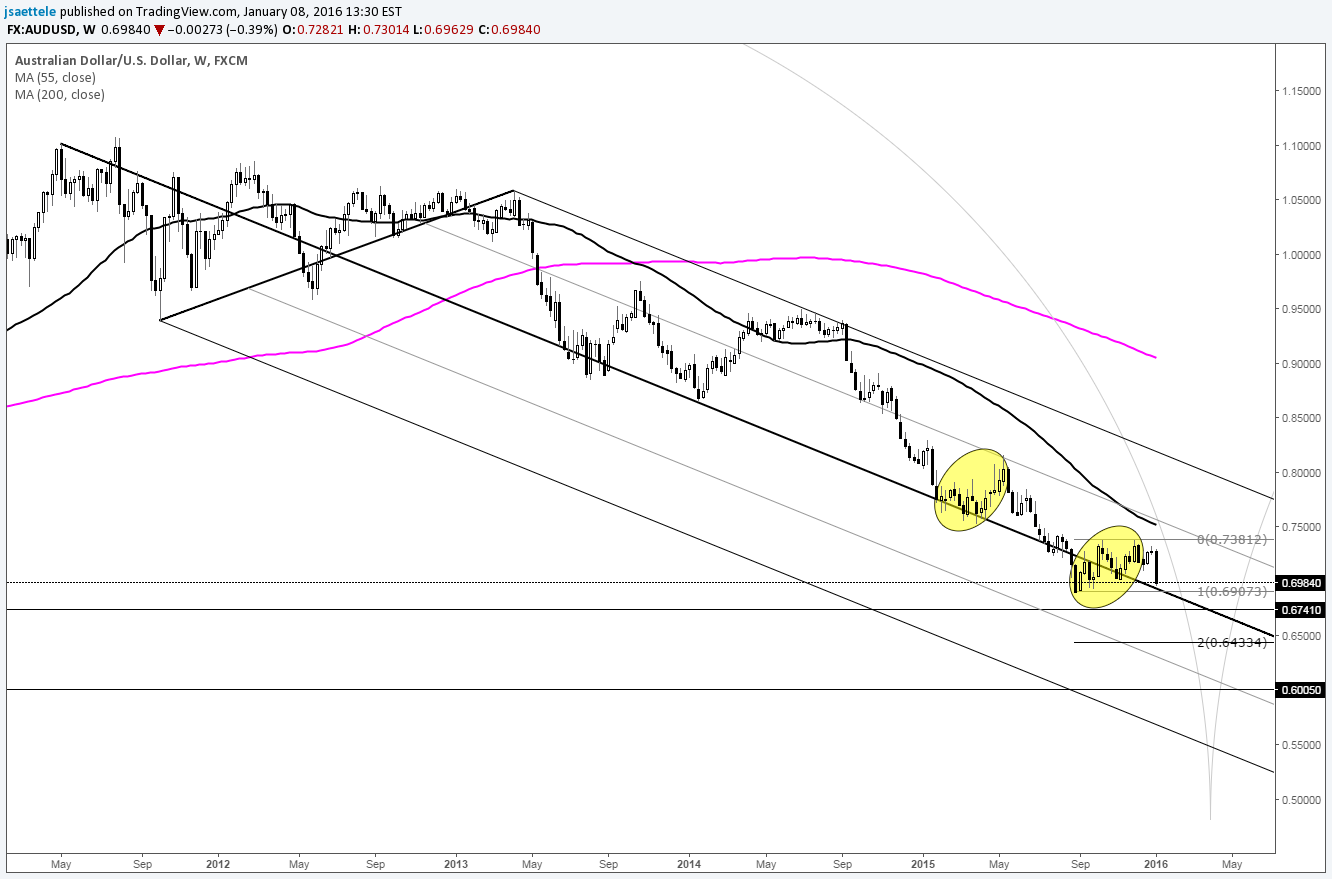
Chart Prepared by Jamie Saettele, CMT
Automate trades with Mirror Trader
-Recent AUD/USD comments were that “the dominant downtrend is very much intact but there have been prolonged periods of trading around this median line that gave way to decent counter trend moves (rallies). In other words, everything since the September low may very well be corrective but AUD/USD could trade in a more or less nonsensical range for a while longer before the downtrend attempts to reassert.” This week’s (first week of January) action suggests that the downtrend is reasserting.
NZD/USD
Weekly

Chart Prepared by Jamie Saettele, CMT
Automate trades with Mirror Trader
-FXTW wrote in the last update that “NZD/USD has responded positively to the mentioned support zone. As such, look higher while above .6428 but beware of resistance around .6805.” The recent top was a bit above .6805…at .6882 but price did remain below the October high. In fact, the October and December highs create a double top within the longer term downtrend. Despite the extent of this week’s (first week of January) decline, reward/risk remains favorable on the downside on a longer term basis. The red lines on the chart indicate a long term RSI trend sell signal (higher RSI and lower price).
USD/JPY
Weekly

Chart Prepared by Jamie Saettele, CMT
Automate trades with Mirror Trader
-The uptrend that USD/JPY enjoyed since the December 2012 breakout is over. The cross topped nearly 7 months ago at a long term trendline. All of this doesn’t mean that USD/JPY can’t or won’t experience rallies. All of this does mean that rallies should be sold. Be patient and use stops, as outlined in the popular TOST series. As outlined in the Q1 technical outlook, a head and shoulders pattern would yield a target near 105.
Monthly

Chart Prepared by Jamie Saettele, CMT
Automate trades with Mirror Trader
-The most recent FXTW comments were that “new highs could carry to the next parallel near 1.38. We’re now above 1.41! Extremely long term slope analysis reveals that the 1976-1991 line, which was resistance (not precise however), could end up as support again on the next ‘correction’. That line is around 1.3600. If USD/CAD is going to ‘correct’, which might it correct from? There are a host of yearly price extremes (1986 high, 1995 high, and 2000 low) in the 1.4270-1.4420 zone. Keep those levels in mind for capitulation.
Weekly
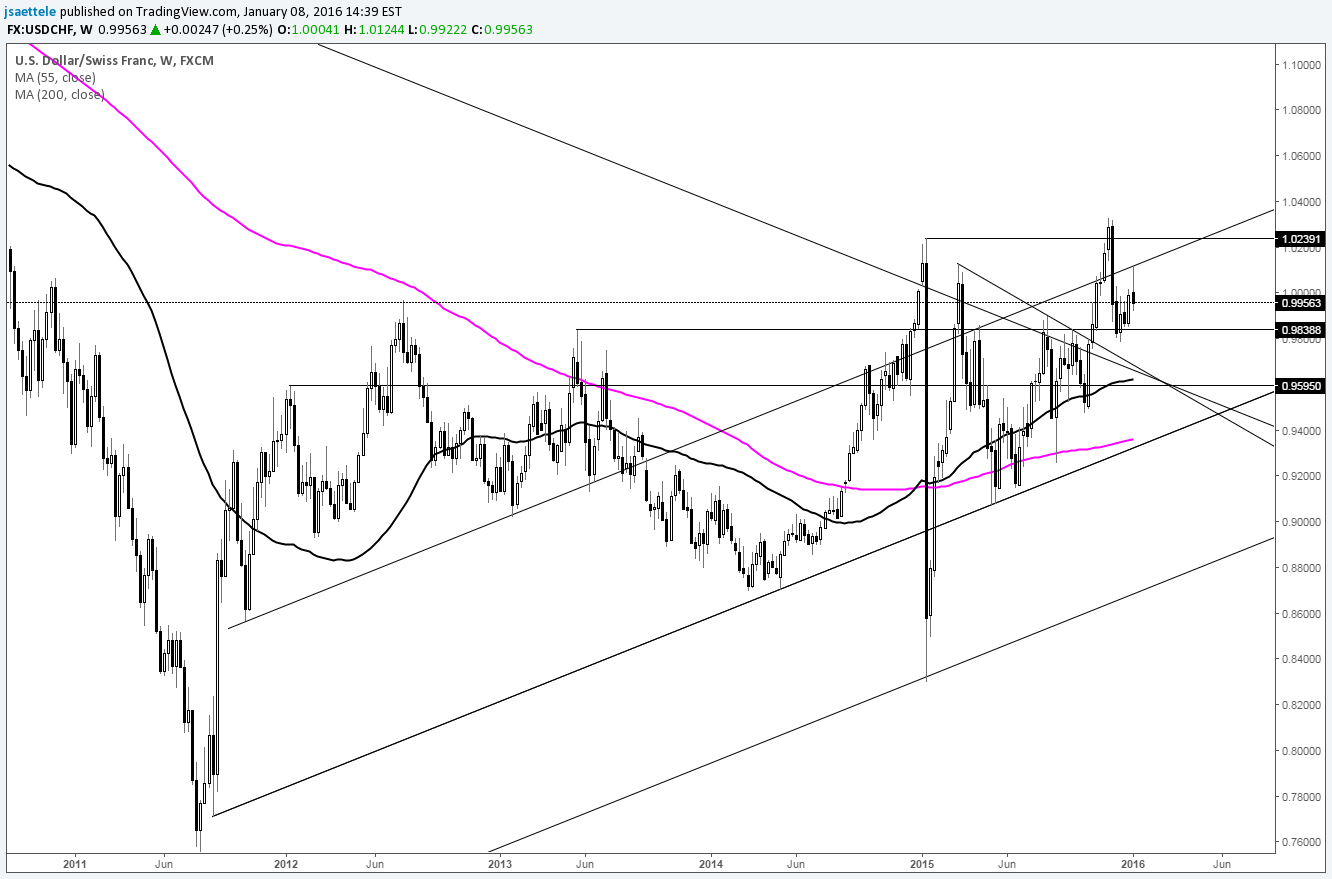
Chart Prepared by Jamie Saettele, CMT
Automate trades with Mirror Trader
-Some extremely long term technical considerations are worthy of note when looking at USD/CHF. Read about them here …Near term however, the breakout from the 7 month triangle in USD/CHF has failed. Support may reside near .9600 (topside of former triangle line).
BONUS CHART
SPX500
Weekly
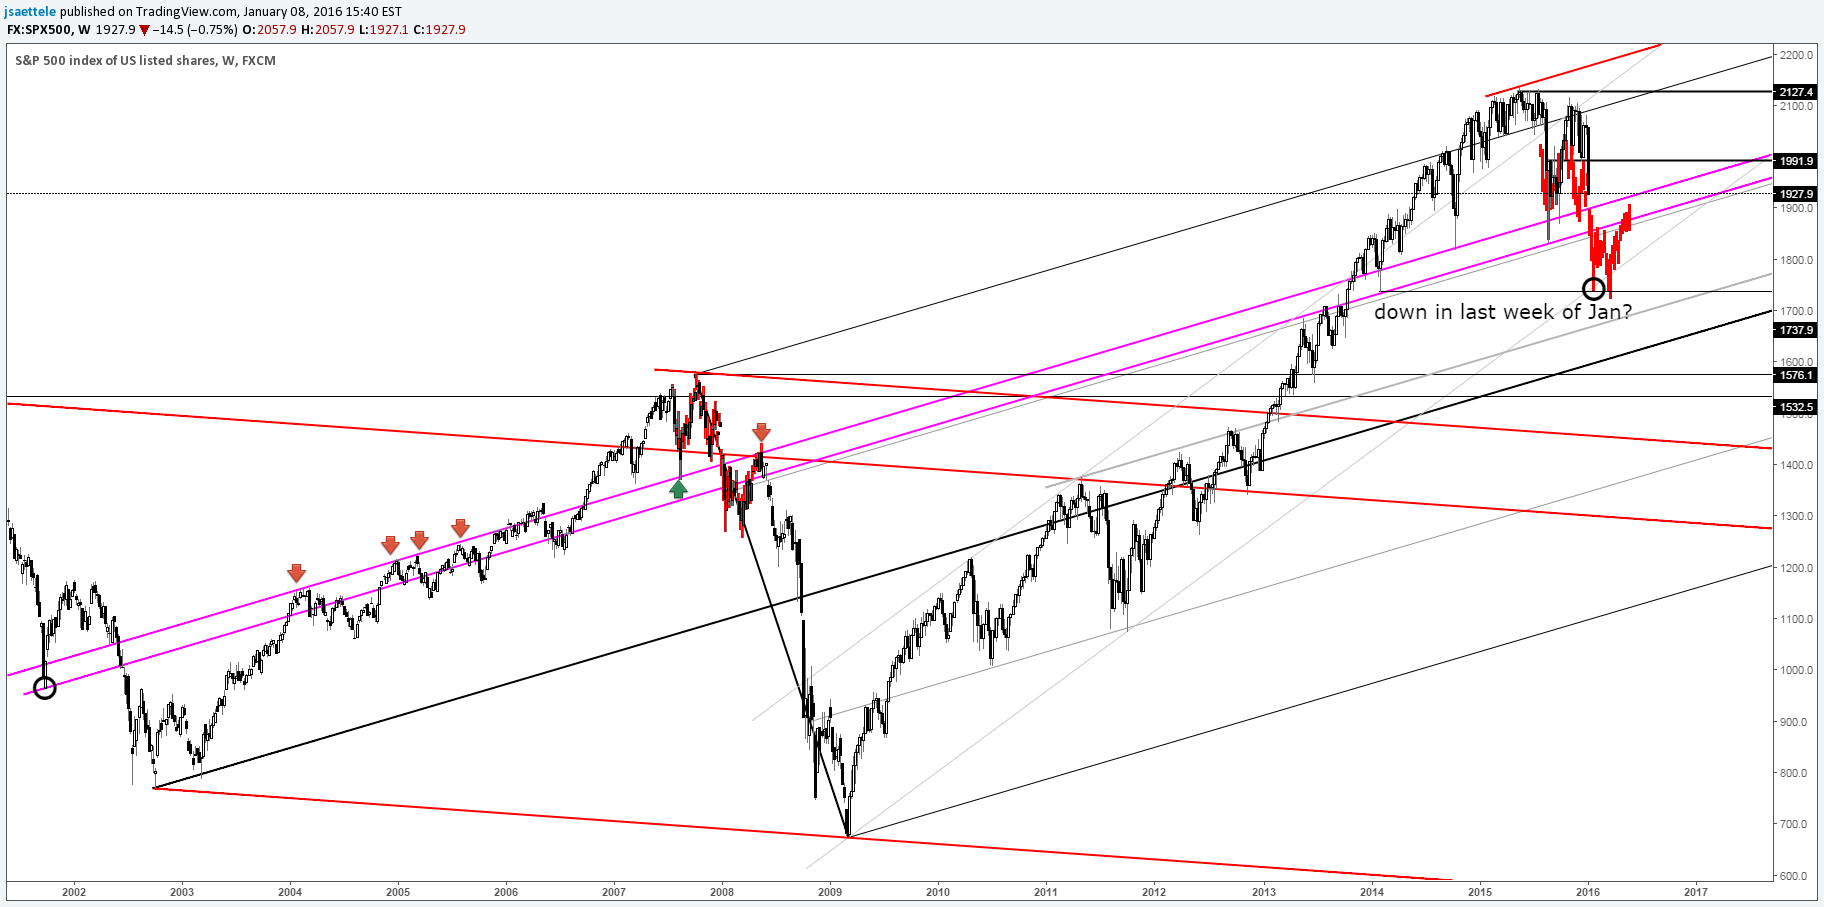
Chart Prepared by Jamie Saettele, CMT
-Some comparisons with 2008 have been made in the news lately. Technically, there actually are some similarities. Consider that; the SPX500 declines sharply into August 2007 and August 2015. The ensuing rallies retraced all of the 2007 decline and most of the 2015 decline. In both years, December was weak and January started off weak. The times series’ are far from the same but there are similarities. In 2007, weakness accelerated into 1/24 before a corrective process unfolded began that stretched into May. You could then “sell in May and go away.”
BONUS CHART II
DAX
Monthly
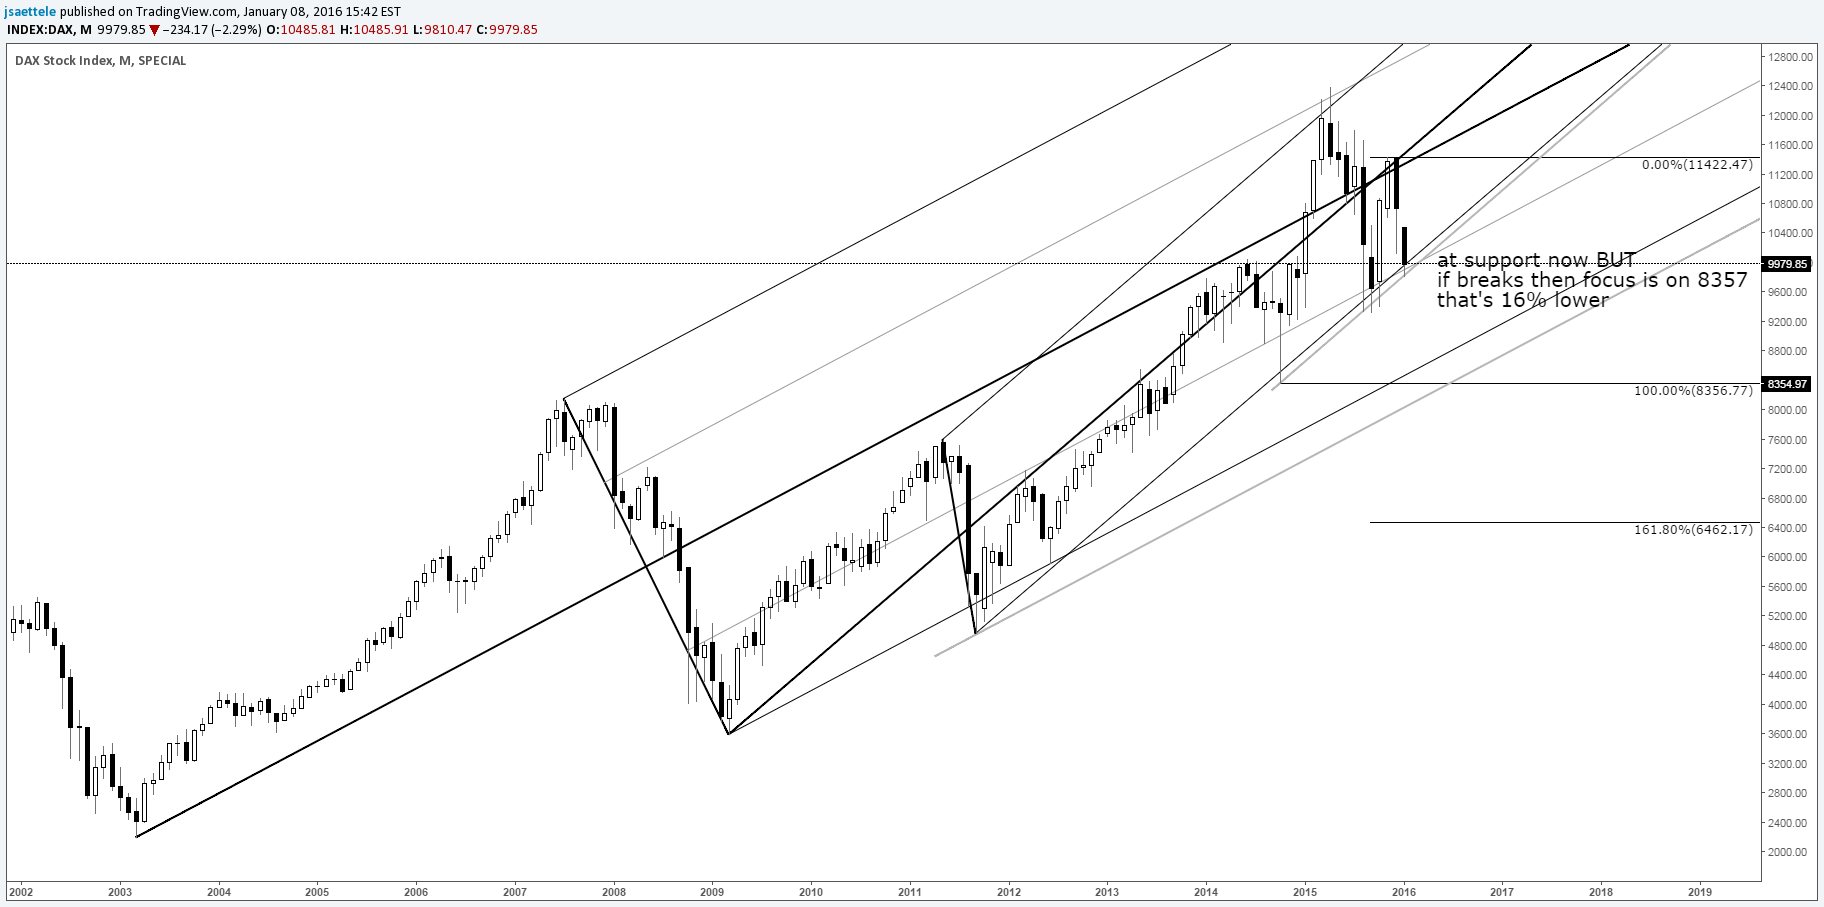
Chart Prepared by Jamie Saettele, CMT
-We’ve been telling readers at SB Trade Desk for months that the DAX is far ‘cleaner’ than the SPX500. The picture in the latter is clearing up but the DAX levels are still great. The German index is at big support now. This is the support that identified the October 2014, August 2015, and September 2015 lows. It seems unlikely that this holds again though (my colleague Kristian Kerr often cites Gann’s rule of 4…basically the 4th test of a level is not likely to hold). A break would shift focus (eventually) to where the decline from the 2015 high would consist of 2 equal waves. That level is 8357…which is the exact October 2014 low. There is longer term bullish slope at that level in July. Obviously, the implications for EUR/USD are significant.


