


Mexican Peso Outlook:
- The Mexican Peso’s favorable fundamental and technical considerations have faded in the near-term.
- MXN/JPY rates returned to a bull flag, which formed after trading through multi-year downtrend resistance. USD/MXN rates have been bounding around multi-year support.
- We can use the IG Client Sentiment Index for USD/CAD rates as a close proxy for USD/MXN exposure, which has a mixed bias.
Mexican Peso Stuck in Mud
Even as the three major North American economies are moving towards normalcy, particularly the case in Canada and the United States, the growth-sensitive Mexican Peso has failed to build on its gains from earlier in 2Q’21. Stability in long-end global bond yields and a pullback in global commodity prices, particularly agriculture and industrial base metals, has undercut the near-term fundamental argument for a stronger Mexican Peso. Eroding momentum suggests that technical considerations have started to weaken as well.
Mexican Peso Economic Calendar - Rest of Week
The Mexican Peso is still dealing with news reverberating from last week, when Mexican President Andres Manuel Lopez Obrador announced that he would not be nominating current Banxico Governor Alejandro Diaz de Leon for a second term. AMLO’s intentions were clear, noting the replacement would be one “with a social dimension, one who is in favor of a moral economy.” The implicit understanding is that the next Banxico Governor may not be has hawkish as their historical predecessors.
Against this backdrop, this week has already produced a slightly stronger than expected reading on the bi-weekly May Mexican inflation rate, which came in at +5.8% versus +5.66% expected (y/y). Today, April Mexican trade balance figures showed a larger than anticipated surplus. These data points confirm information received from Canada and the United States, which suggests an accelerating recovery.
Moving forward through the end of the week, the final 1Q’21 Mexican GDP rate will be released tomorrow, due to show a slowed pace of contraction, at -3.5% from -4.3% (annualized). On Thursday, the April Mexican unemployment is set to be released and could very well drop to a new pandemic-cycle low.
All in all, bits and pieces of evidence of a more resilient Mexican economy than anticipated may not allow bears to take control of the Peso at this time.

USD/MXN Rate Technical Analysis: Daily Chart (February 2020 to May 2021) (Chart 1)
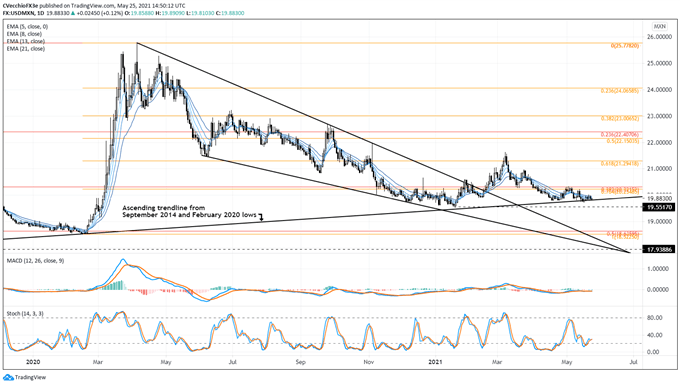
For the better part of the past month, USD/MXN rates have been trading rangebound between the ascending trendline from the September 2014 and February 2020 lows (support) and two key Fibonacci levels (resistance), the 38.2% retracement of the April 2011 low/April 2020 high range at 20.3215 and the 76.4% retracement of the 2020 low/high range at 20.2349. The pair is on neutral footing until either side of this range gives way; a drop below trendline support would bring focus back to the yearly lows at 19.5517.
MXN/JPY Rate Technical Analysis: Daily Chart (January 2020 to May 2021) (Chart 2)
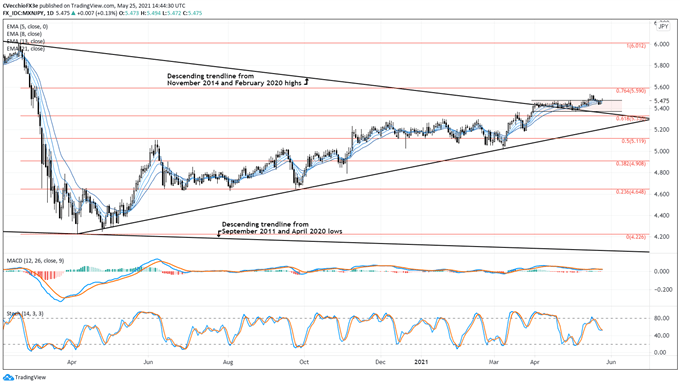
In the prior MXN/JPY rate forecast update it was noted that “the passage of time has seen MXN/JPY rates carve out a sideways range as its crept out of the descending trendline from the November 2014 and February 2020 highs, suggesting a bull flag has been carved out…the recent sideways drift in MXN/JPY rates over the past few days may simply be a pause before fresh highs are reached anew. The 76.4% Fibonacci retracement of the 2020 high/low range at 5.579 may be initial resistance if the bullish breakout ensues.”
While the bullish breakout began, there was no follow-through. MXN/JPY rates have made two concerted attempts to begin a move higher, but just like earlier this month, the current effort appears to be failing with a daily inverted hammer (shooting star) materializing.
Momentum is lacking in either direction for MXN/JPY rates. The pair is above its daily 5-, 8-, 13-, and 21-EMA envelope, which is in bullish sequential order. But daily MACD is declining while above its signal line and daily Slow Stochastics are still dropping towards their median line. If there has been a silver lining, the pullbacks in the indicators from overbought conditions was not met by a significant pullback in MXN/JPY rates.

Using a Proxy to Track USD/MXN Retail Positioning
With respect to the difference in performance between USD/CAD and USD/MXN rates in recent weeks, it should be noted that the Canadian economy is more independent from the US economy than is the Mexican economy. While the United States is both countries’ largest trading partner, over 80% of Mexico’s exports go to the United States (compared to near 70% for Canada), while 30% of Mexico’s GDP is derived from economic activities involving the United States (compared to 20% for Canada).
The close proximity of both countries given their trade relationship with the United States also means that their currencies tend to trade in a similar fashion as well. In other words, there is a reasonable basis of expectation for USD/CAD and USD/MXN rates to trade in a similar fashion.
However, after the BOC decided to abruptly announce a tapering to their QE program, the relationship between USD/CAD and USD/MXN remains frayed in the near-term. At present, the 5-day correlation between the pairs is currently +0.56 while the 20-day correlation is +0.72. One week ago, on May 18, the 5-day correlation was +0.69 and the 20-day correlation was +0.07.
IG CLIENT SENTIMENT INDEX: USD/CADRATE FORECAST (May 25, 2021) (CHART 3)
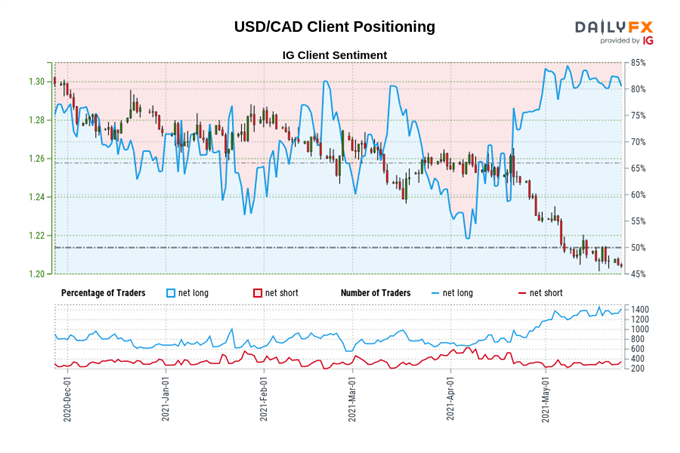
USD/CAD: Retail trader data shows 79.89% of traders are net-long with the ratio of traders long to short at 3.97 to 1. The number of traders net-long is 5.71% higher than yesterday and 9.02% higher from last week, while the number of traders net-short is 10.51% higher than yesterday and 2.22% higher from last week.
We typically take a contrarian view to crowd sentiment, and the fact traders are net-long suggests USD/CAD prices may continue to fall.
Positioning is less net-long than yesterday but more net-long from last week. The combination of current sentiment and recent changes gives us a further mixed USD/CAD trading bias.
--- Written by Christopher Vecchio, CFA, Senior Currency Strategist


