


Technical Analysis via RSI Key Takeaways:
- Commodity FX stands on the extreme overbought
- European Currencies weaken alongside havens backing hedge fund positioning
- JPY stands weak in opposition to option sentiment
Commodity FX is bid at a time when commodities appear to be struggling. Some traders will look to commodity FX as a harbinger of risk sentiment. If the signal holds, traders see opportunities in high-yielding FX that would equate to commodity currencies as well as Emerging Market Currencies like the Mexican Peso.
The specific extremes within the G10 and crosses sits with the Australian Dollar and New Zealand Dollar with marked weakness in the European Currencies and the US Dollar.
Surprisingly, the US Dollar would now qualify as a high-yielding currency, given the forward's markets expect the Federal Reserve to have a higher reference rate than the Reserve Bank of Australia one year from today. However, concerns are lingering regarding the G10 as trade rhetoric heated up against Europe and China against the US over the weekend.
For traders looking for a fundamental justification to the AUD-bid, The Australia Prime Minister Malcolm Turnbull confirmed that Australia won a reprieve from the United States’ global steel and aluminum tariffs showing that his bromance with US president Trump appears to be paying off.
However, given the vanished yield premium, it’s hard to favor the view that the AUD will see a We don’t see a lasting boost to AUD from this source, because it is not clear that it should stem broader declines in commodities prices. As you’ll see on the charts, the long-term trends seem to favor fading rallies in AUD.
You can catch last week’s report here: FX Overbought/Oversold: Volatility & Extremes Presenting Opportunity
As a reminder, this report will look to a foundational technical indicator, called the Relative Strength Index or RSI calculated over 3-periods to derive trading insights that can help with entries into a trade.
To learn how to manage your trades better, check out our free trading guides here
Overbought FX Pairs and Individual Currencies as of March 12, 2018
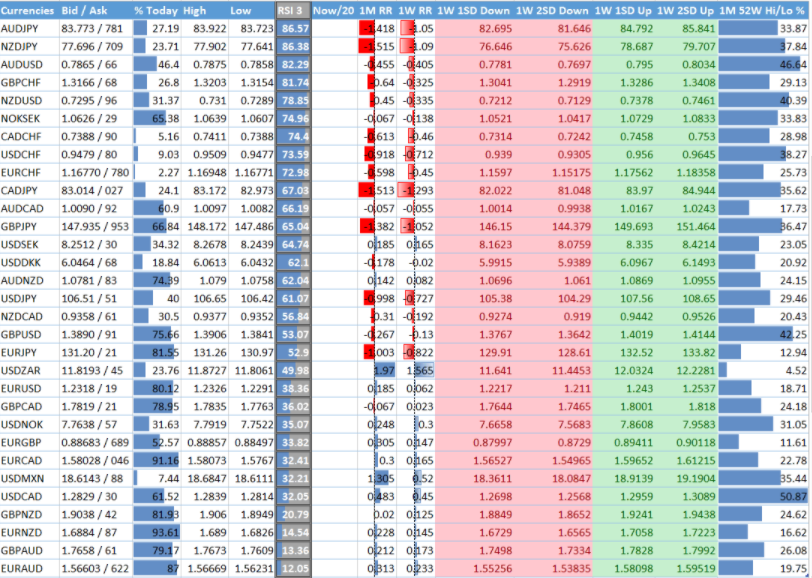
Data source: Bloomberg
Current FX Opportunities in Focus
A quick look above, and you can see that the 3-top overbought pairs (AUD/JPY, NZD/JPY, and AUD/USD) per RSI(3) all show commodity FX strength. On the opposite side of the distribution, 4 of the top-5 weakest pairs per RSI(3) have show EU-area currency weakness.
Two data points favor cooling favor on an immediate resumption in EUR bullishness. First, Inflation expectations have pulled back when looking at EU 5yr forward inflation swaps and Hedge Funds are continuing to pull back their long exposure to the lowest levels of 2018 per the CFTC Commitment of Trader report. Adding color to the fading optimism of the EUR is the lack of premium that options traders are willing to pay to protect against outsized EUR gains.
AUD/JPY Sitting At Bullish Extremes Similar To Heights Before the Last Downturn
RSI(3) distributions should be looked at in the context of the broader trend, which for AUD/JPY per Ichimoku is lower. Therefore, when you have a highly overbought currency per short-term momentum within a broader downtrend, keep an eye on the price breaking below support in evidence of downtrend continuation.
On the chart below, such a development would be confirmedby a break below the 2018 closing low at 75.56 JPY per AUD. Additionally, a break below the 1 week 1 Std. Deviation bearish target of 82.73 would show a likely reversion to the mean and potential resumption of the downtrend.
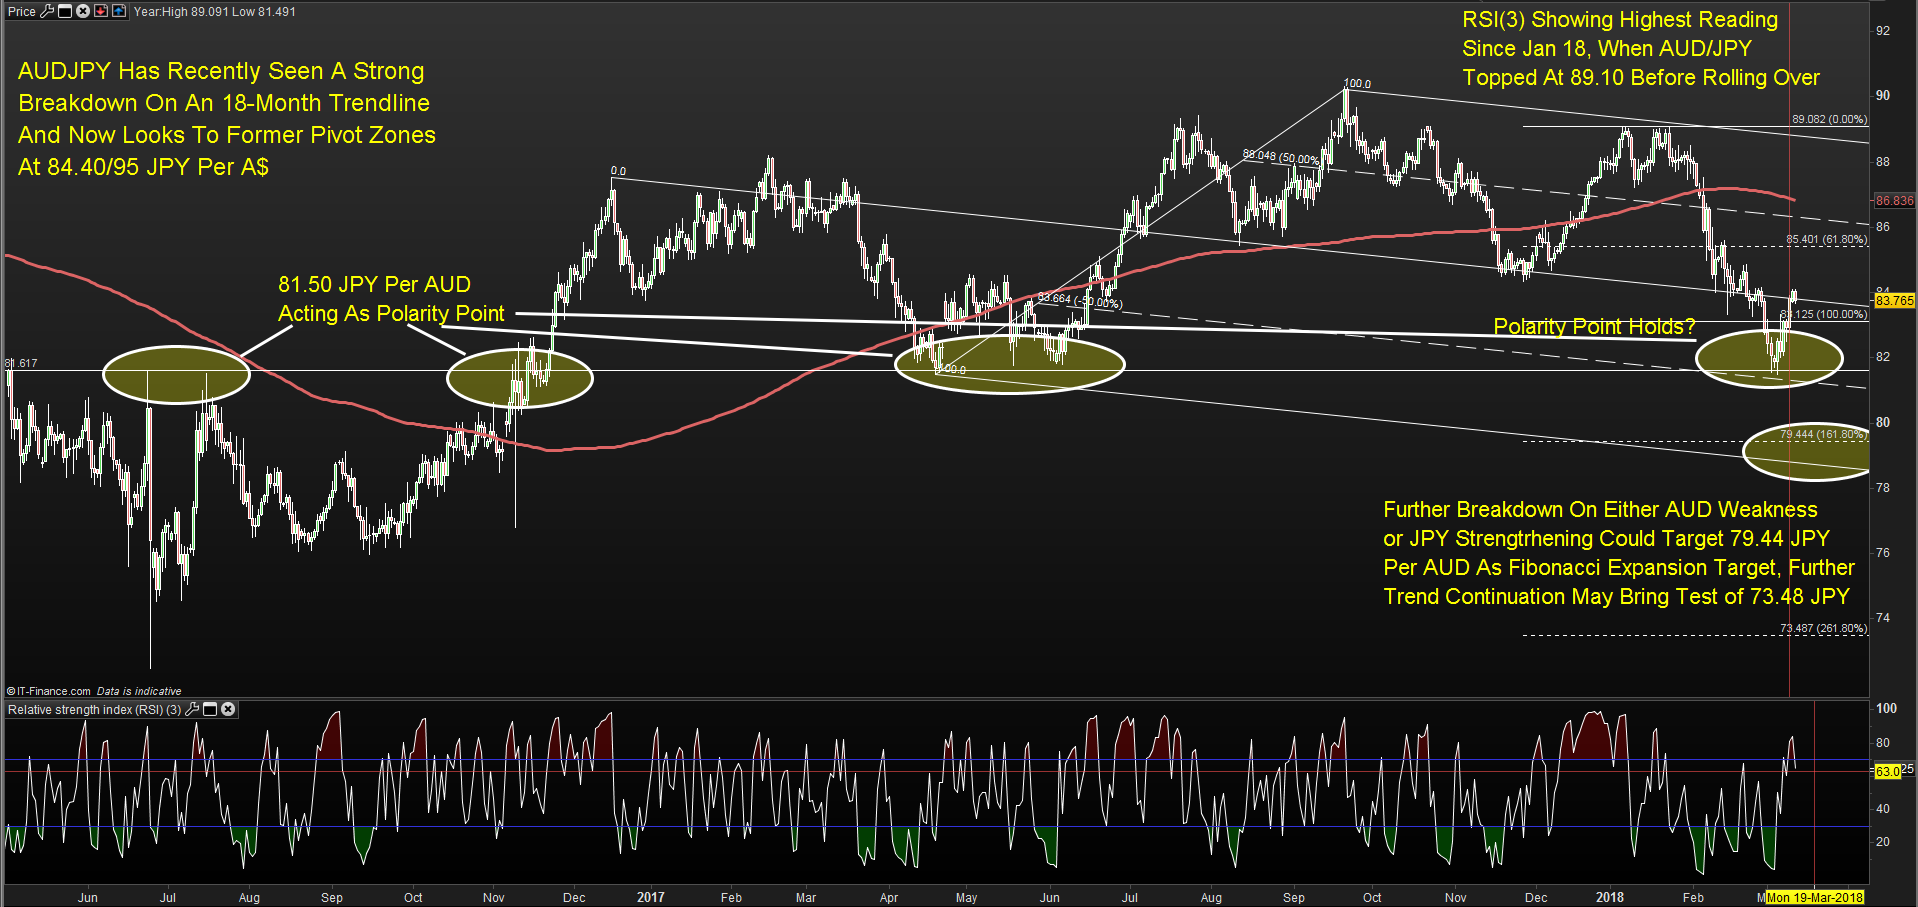
Chart Source: ProRealtime, IG UK Price Feed. Created by Tyler Yell, CMT
EURAUD Moving Away From Channel Resistance, Next Move Could Prove Pivotal

Chart Source: ProRealtime, IG UK Price Feed. Created by Tyler Yell, CMT
The trend on EUR/AUD has been unmistakably higher. The chart above shows a pull-back from the top of a channel that starts from key pivots as early as December 2016. The spot price has pulled back to the February support zone of ~1.57 while RSI(3) shows an aggressive oversold reading per the dashboard above.
Ichimoku Cloud analysis has been applied to the daily chart, which should keep Bears quiet until a break below the cloud at 1.5476 while a break below the 200-DMA at 1.5262 would understandably convince bears they’re on the right side. A break below these support point would bring a confluence of concerning signs around the EUR mentioned early could be in the early stages of playing out and causing institutions to reduce their recent record long exposure.
AUD/USD Sentiment Favor Upside While Technical Analysis Show
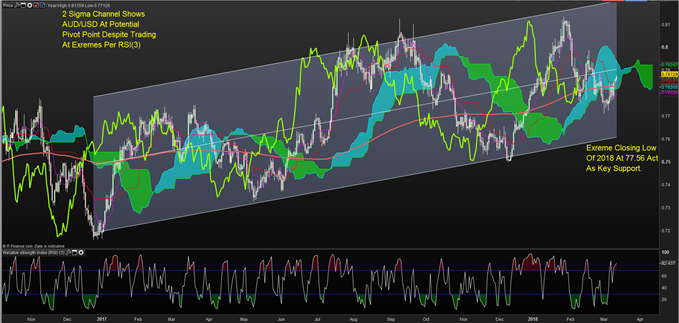
Chart Source: ProRealtime, IG UK Price Feed. Created by Tyler Yell, CMT
AUDUSD has come to the median of a one-year 2-standard deviation channel. You’ll notice that the pair has trended well within this channel from one extreme to the next. However, we have not seen a move to the lower bound (-2 sigma.)
A break below the closing low of 2018 at 77.56 US cents per AUD would likely be all the warning given to traders that an approach on the lower bound was in the works. The 50% of the 2018 range, and anticipated resistance if the downtrend is not complete is at 79.25 US cents per AUD followed by the 61.8% retracement at 79.74 US cents per AUD. A break above this level could indicate broader AUD strength could continue.
Looking To Add More To This Analysis? Try IG Client Sentiment
AUD May Rally Against the Dollar On Increase In Short Retail Positions

Retail Sentiment Signal on March 12: We typically take a contrarian view to crowd sentiment, and the fact traders are net-short suggests AUDUSD prices may continue to rise. Traders are further net-short than yesterday and last week, and the combination of current sentiment and recent changes gives us a stronger AUDUSD-bullish contrarian trading bias.
Access Real-Time Sentiment Analysis Here
Explanation of Columns Above:
The key column per this report is the RSI(3) column, which is showing the current calculation of the short-term RSI on key currency pairs. The default RSI setting is 14, which makes up nearly 3-weeks of trading data. Naturally, a 3-period RSI is much more sensitive to current moves in the market as opposed to looking over the last 14-days.
Learn more about using and trading with the Relative Strength Index here
How I Use This Data In My Trading:
Being a fan of trading in the direction of the trend has taught me over the years to look for opportunities at a favorable price to enter in the direction of the trend. When using this data, I am looking for an oversold reading in a well-defined uptrend to identify favorable buying opportunities or an overbought reading in a well-defined downtrend to identify favorable selling opportunities.
Traditionally, a reading above 70 on RSI favors an overbought reading, while a reading below 30 signals an oversold reading. It’s worth noting that reversals are rare, so you want to be as aware of a new normal or trend breakout, as you do an extreme counter-trend reading that may present you an excellent risk-adjusted trading opportunity.
New to FX trading? No worries, we created this guide just for you.
---Written by Tyler Yell, CMT
Tyler Yell is a Chartered Market Technician. Tyler provides Technical analysis that is powered by fundamental factors on key markets as well as t1rading educational resources. Read more of Tyler’s Technical reports via his bio page.
Communicate with Tyler and have your shout below by posting in the comments area. Feel free to include your market views as well.
Discuss this market with Tyler in the live webinar, FX Closing Bell, Weekdays Monday-Thursday at 3 pm ET.
Talk markets on twitter @ForexYell
Join Tyler’s distribution list.


