


- The US Dollar/Japanese Yen exchange rate remains strongly correlated to the S&P 500
- A breakdown in the USD/JPY seems likely to coincide with important S&P volatility
- Watch key support levels as markets near a potentially significant turning point
The correlation between the US Dollar/Japanese Yen exchange rate and the S&P 500 trades at multi-year highs. Here is why we think this is significant.
Recent volatility in the S&P 500 has coincided on a nearly tick-for-tick basis with moves in the USD/JPY, and indeed we see reason to believe that a breakdown in the USD would likely accompany a much-larger movement in global stock markets. Why?
Correlation between US Dollar/Japanese Yen Exchange Rate and S&P 500 Near Record-Strength
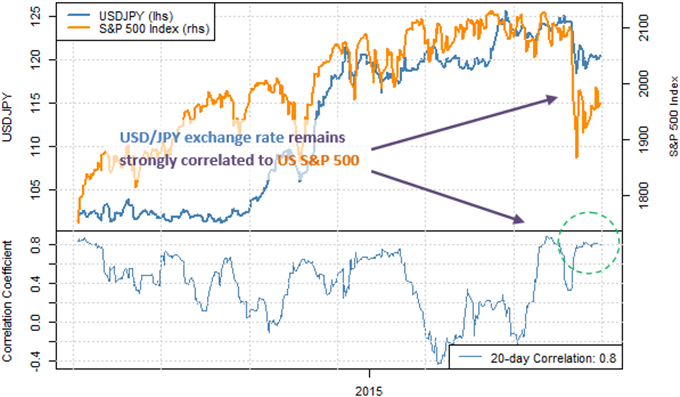
Data Source: Bloomberg. Chart Source: R. Prepared by David Rodriguez
Put simply, we see a strong link between which currencies have rallied in the past week versus overall speculative positioning. A closer look at the USD/JPY in particular shows that large speculators severely scaled back USD-longs amid sharp moves in the S&P 500.
Large Speculators Severely Scale Back on USD/JPY (via CFTC Commitment of Traders report)
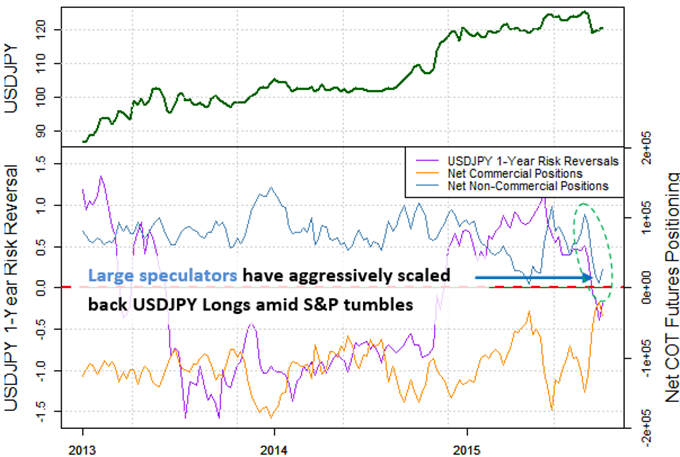
Data Source: Bloomberg, CFTC. Chart Source: R. Prepared by David Rodriguez
Similar episodes of financial market panic would likely lead to comparable moves in the US Dollar versus the Japanese Yen. This dynamic could prove especially significant given that the USD/JPY trades near pivotal volume and price-based congestion support.
USD/JPY Trades near Critical Support at the ¥119 Mark
Total Buy Volume Executed, Total Sell Volume Executed, Net Volume Executed (Buy-Sell)
Length of bar indicates the sum of Buy and Sell volume.
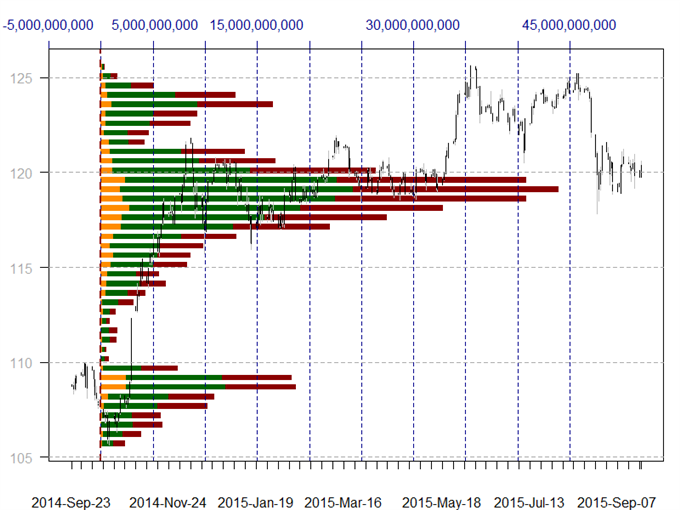
Data source: FXCM Real Directional Volume Indicator, Chart source: R. Prepared by David Rodriguez
Last week we argued that the US Dollar could see a substantive shift in trend given that many major USD pairs traded near potentially pivotal technical levels. The strong correlation between the USD/JPY and S&P 500 and broader global equities suggests that a move in one could coincide with a similar shift in the other. Or in short: any sharp S&P 500 declines could point to a USD/JPY breakdown and vice-versa.
See the correlations update below to see other important links through the past month of price action.
Forex Correlation Summary
Forex correlations against major currencies, Crude Oil, and the S&P 500 index for the past 30 calendar days:
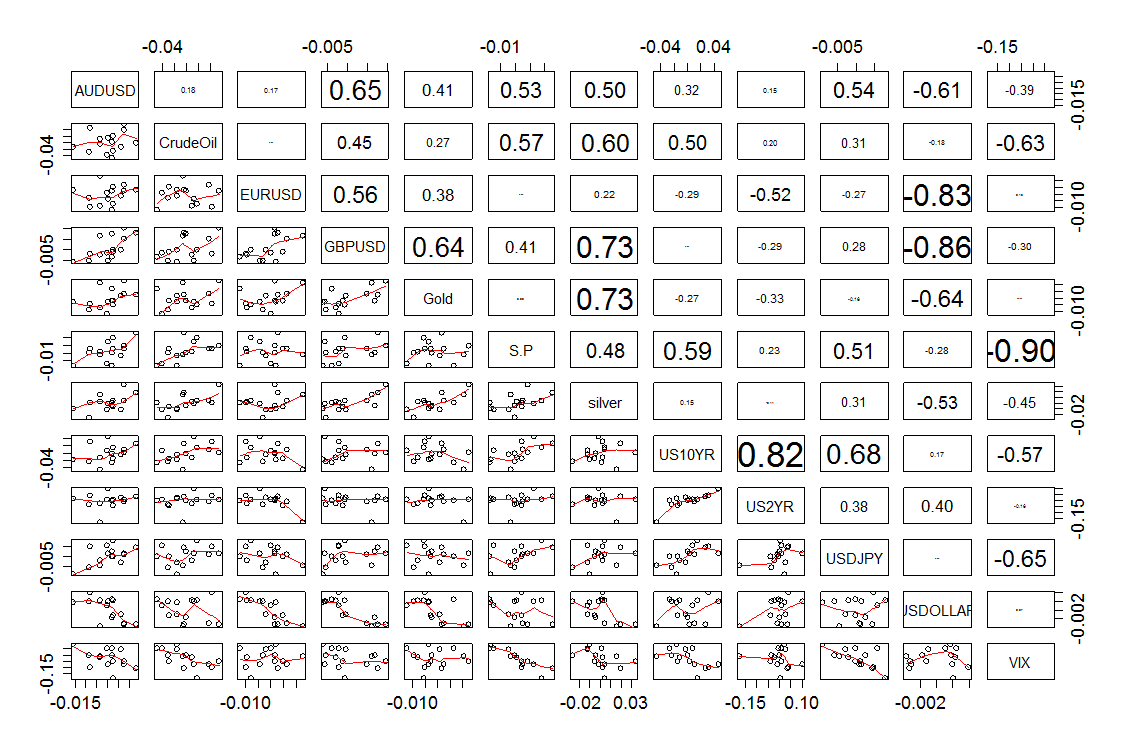
Read a guide on understanding the forex correlations summary chart.
Written by David Rodriguez, Quantitative Strategist for DailyFX.com


