


British Pound vs Canadian Dollar Technical Forecast
GBP/CAD- Multi-Month High
Last week, GBP/CAD hit a near three-month high of 1.7675. However, the price declined after as some bulls seemed to cut back. Ultimately, a weekly candlestick closed in the green with a 2.2% gain.
Alongside that, the Relative Strength Index climbed and remained in overbought territory emphasizing the strength of the bullish momentum.
GBP/CAD Daily PRICE CHART (Feb 1, 2018 – AUGUST 3, 2020) Zoomed Out
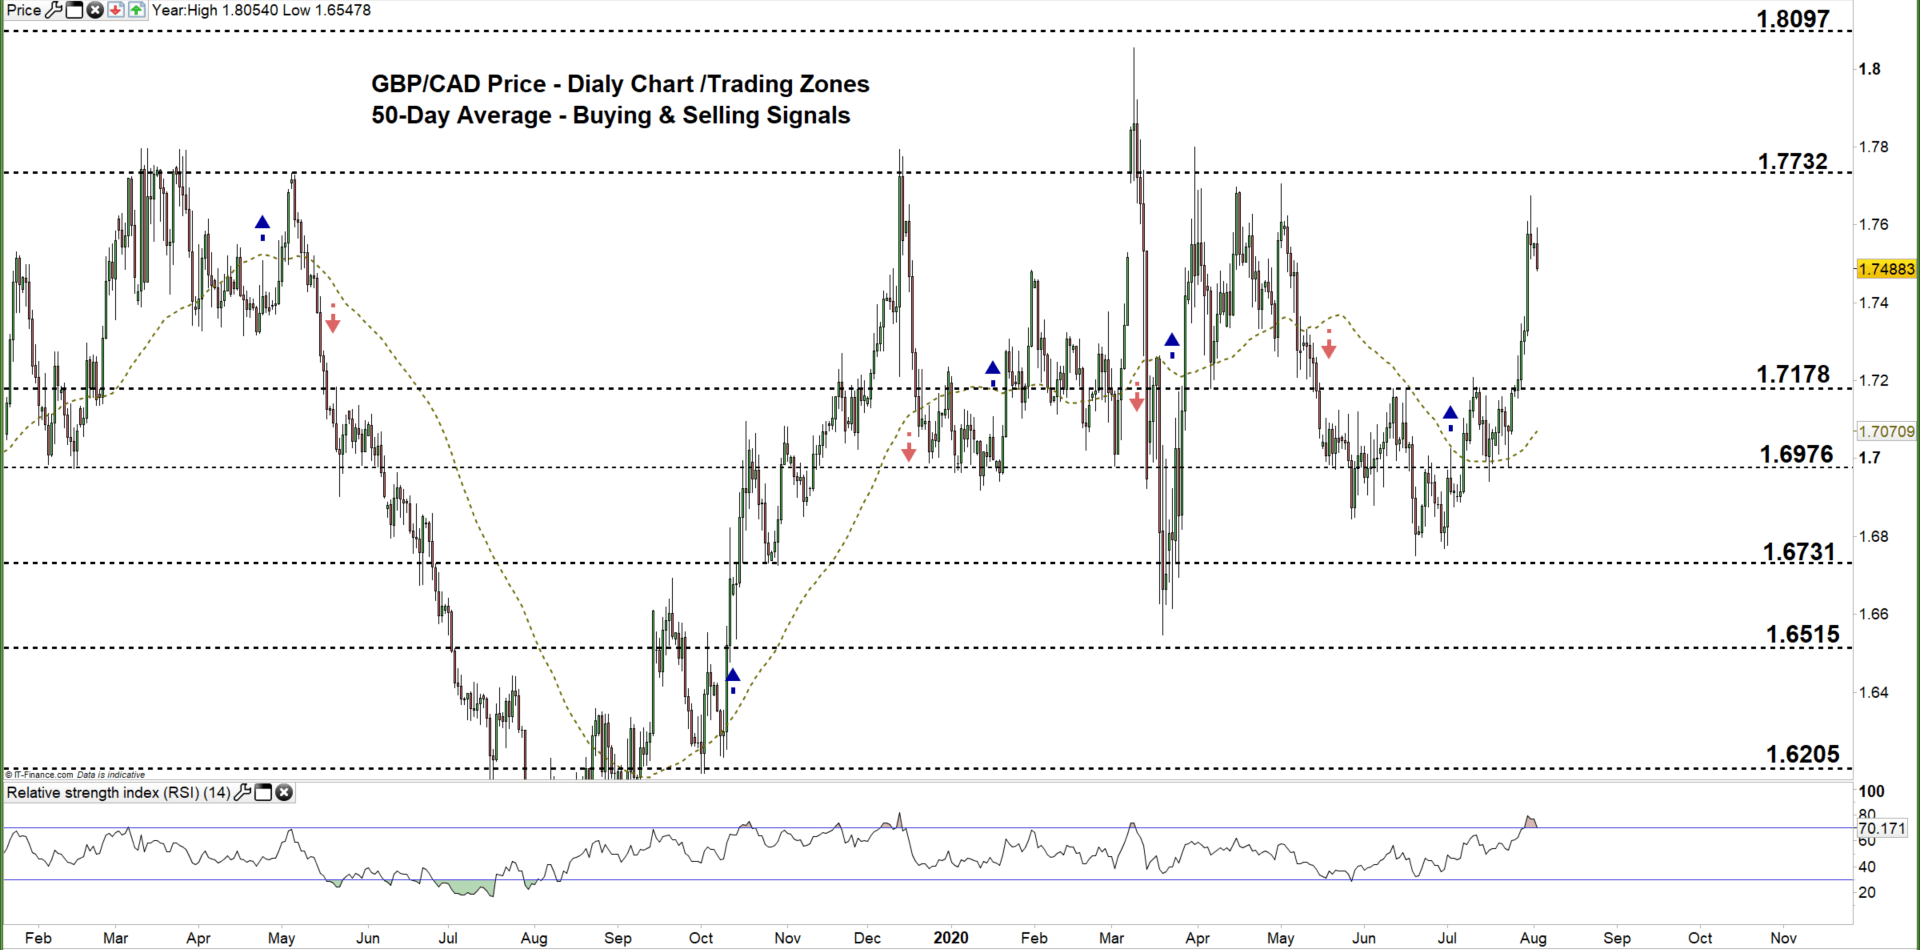

GBP/CAD Daily PRICE CHART (MAY 1 – AUGUST 3, 2020) Zoomed In

Since July 15, GBP/CAD has failed on multiple occasions to close below the 50- day moving average repeatedly rebuffing efforts to put bears in charge. Last week, the price ended its sideways move and climbed to the current 1.7178- 1.7732 trading zone and tipping the balance towards the bull’s side.
A daily close above the high end of the current trading zone may encourage bulls to extend the rally towards the monthly resistance level at 1.8097 (April 2016 low).
On the other hand, a failure in closing above the high end of the zone reflects bull’s hesitations and may ultimately guide GBPCAD’s fall towards the low end of the current trading zone (June 16 high).

GBP/CAD Four Hour PRICE CHART (July 2 – AUGUST 3, 2020)
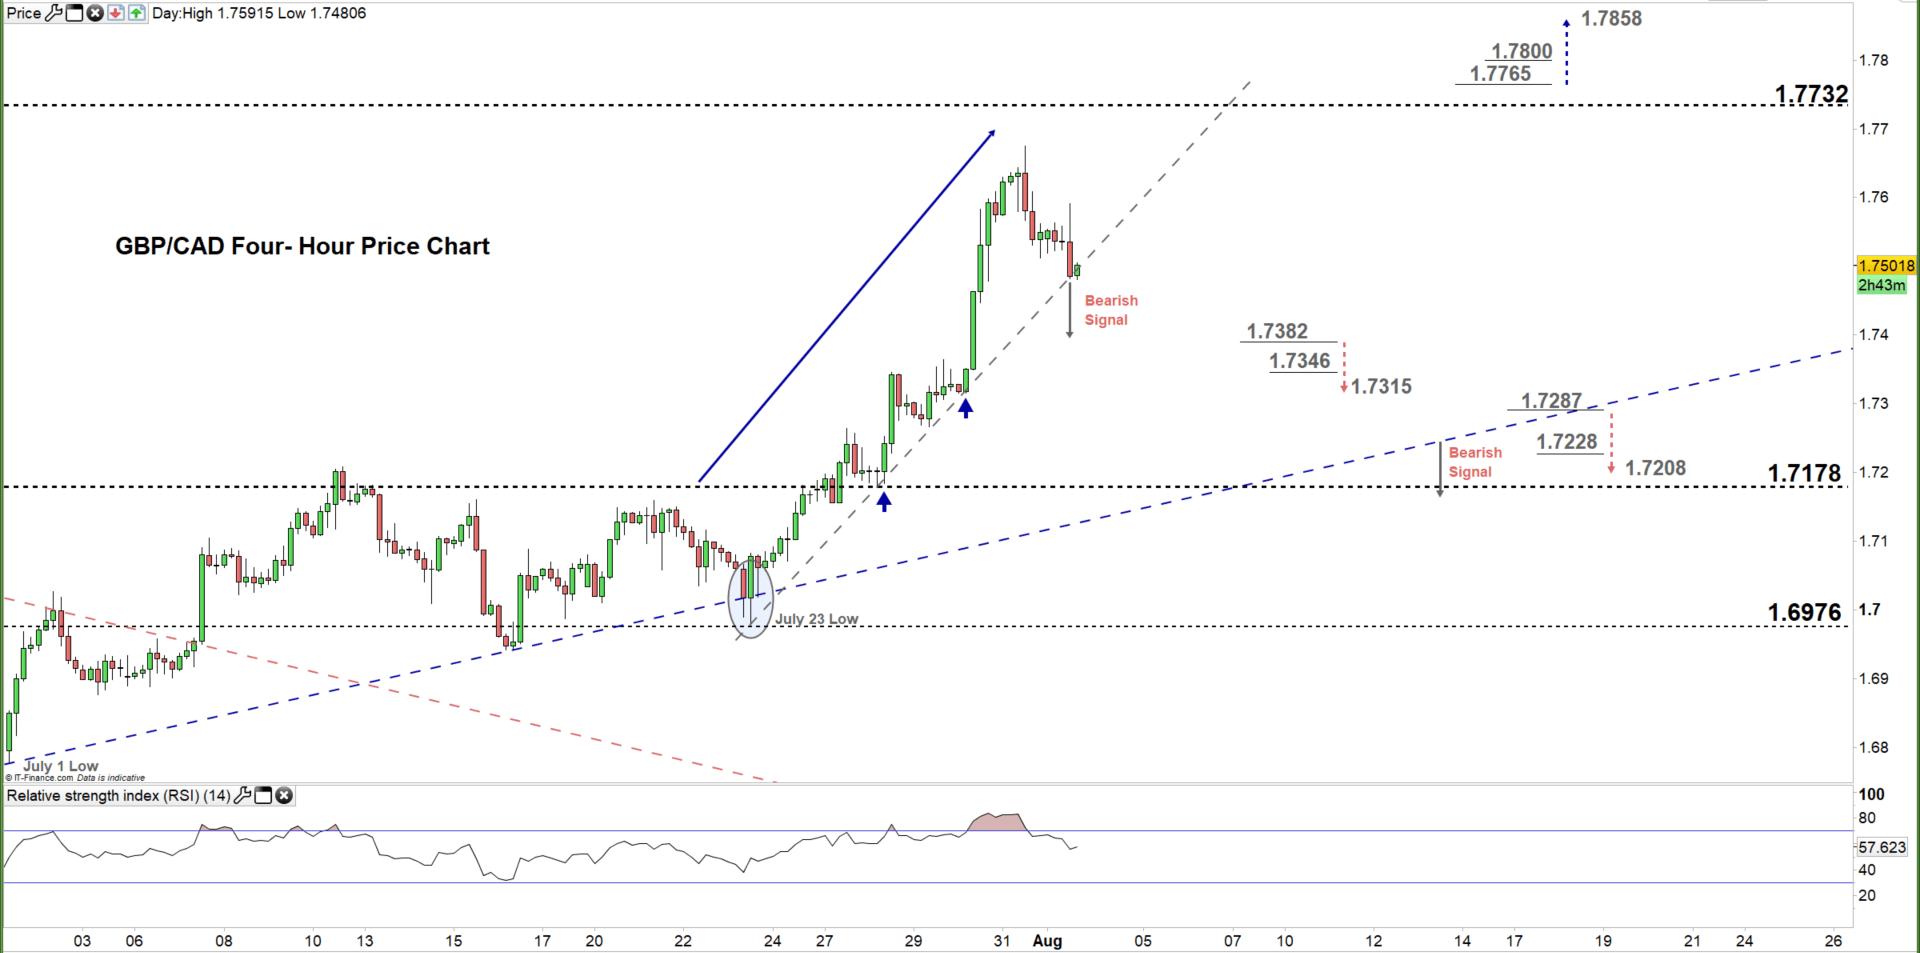
Last week, GBP/CAD created a sharp upward trendline support originating from the July 23 low at 1.6979 highlighting an accelerated bullish momentum.
To conclude, while bulls have the upper hand a break below the aforementioned bullish trendline support reflects a weaker bullish bias.
Therefore, a break below 1.7382 may send GBPCAD towards the 1.7315, while a break above 1.7765 may cause a rally towards 1.7858. As such, the support and resistance levels marked on the four-hour price chart should be considered.
Written By: Mahmoud Alkudsi, Market analyst
Please feel free to contact me on Twitter: @Malkudsi


