


Canadian Dollar vs Japanese Yen Technical Forecast
- Bearish momentum has eased, but the bias lower remained
- Negative outlook while below 78.68
CAD/JPY- Weaker Bearish Sentiment
Last week, CAD/JPY declined to a near ten-week low of 77.61. However, the price rallied after as some bears seemed to cover. Ultimately, a weekly candlestick closed with a Doji pattern highlighting the market’s indecision.
Alongside that, the Relative Strength Index rose from 39 to 49 signaling that bears were losing momentum.
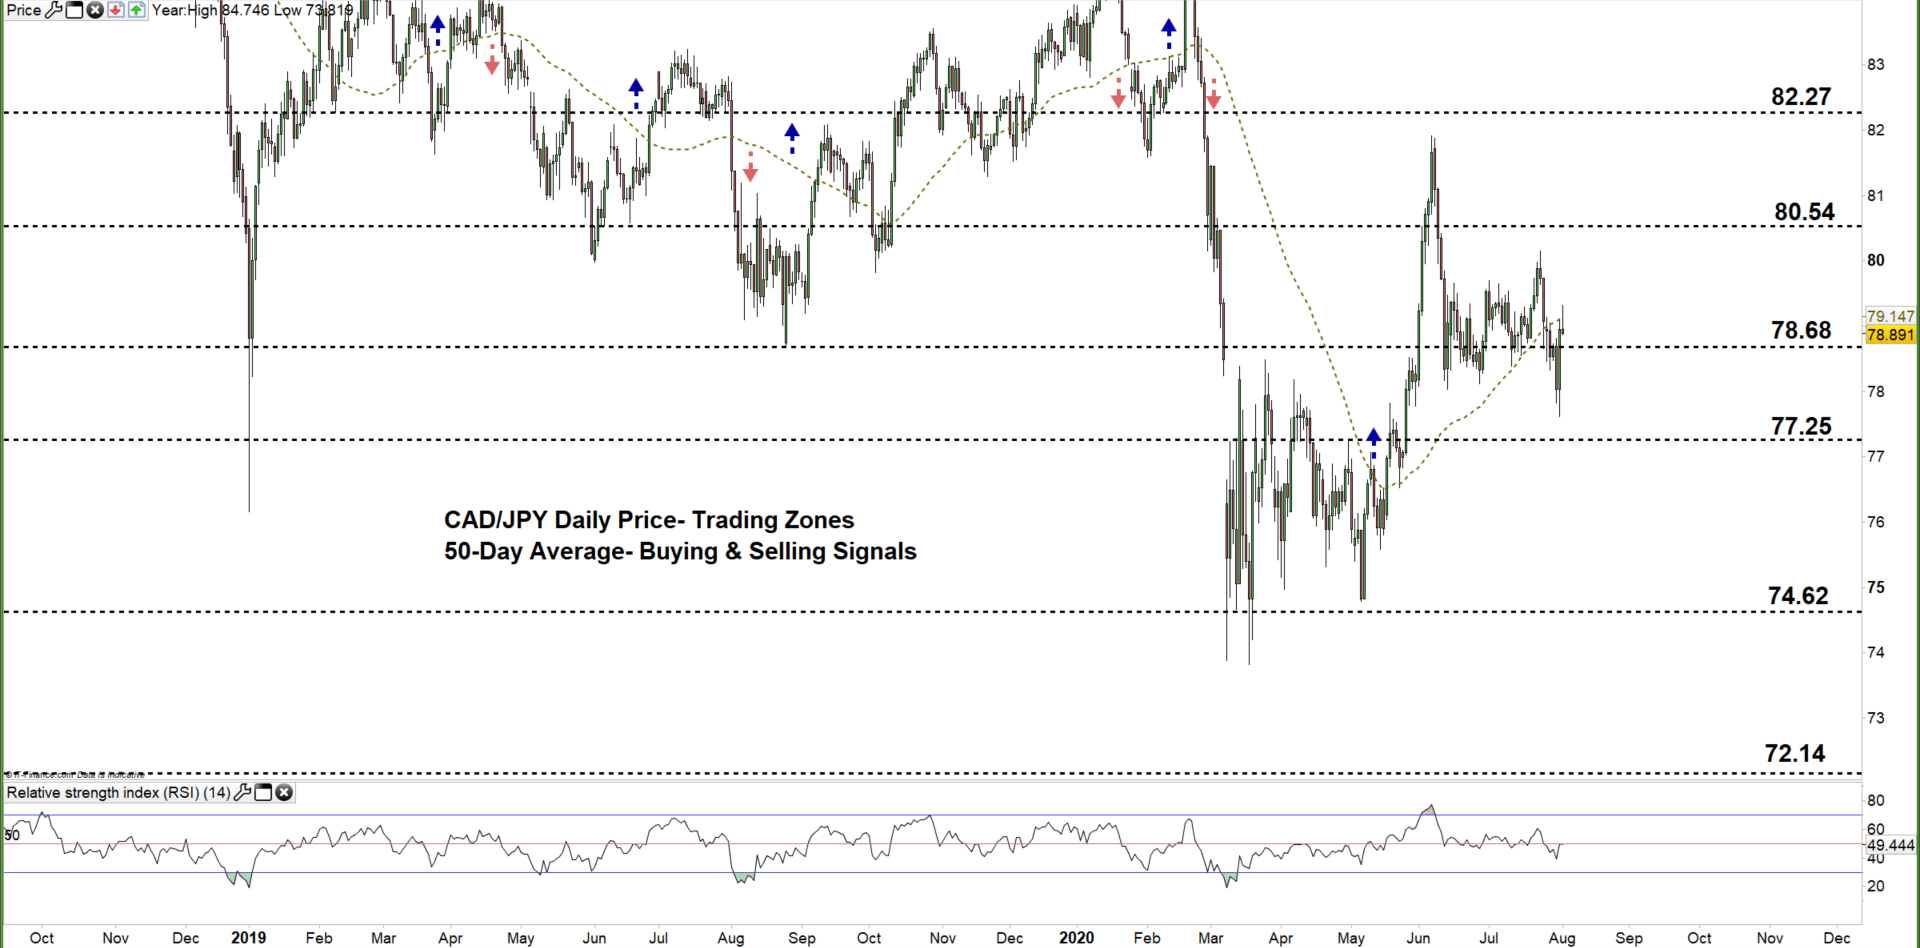
CAD/JPY Daily PRice CHART (October 1, 2018 – August 3, 2020) Zoomed Out

CAD/JPY Daily PRice CHART (June 2 – AUgust 3, 2020) Zoomed In
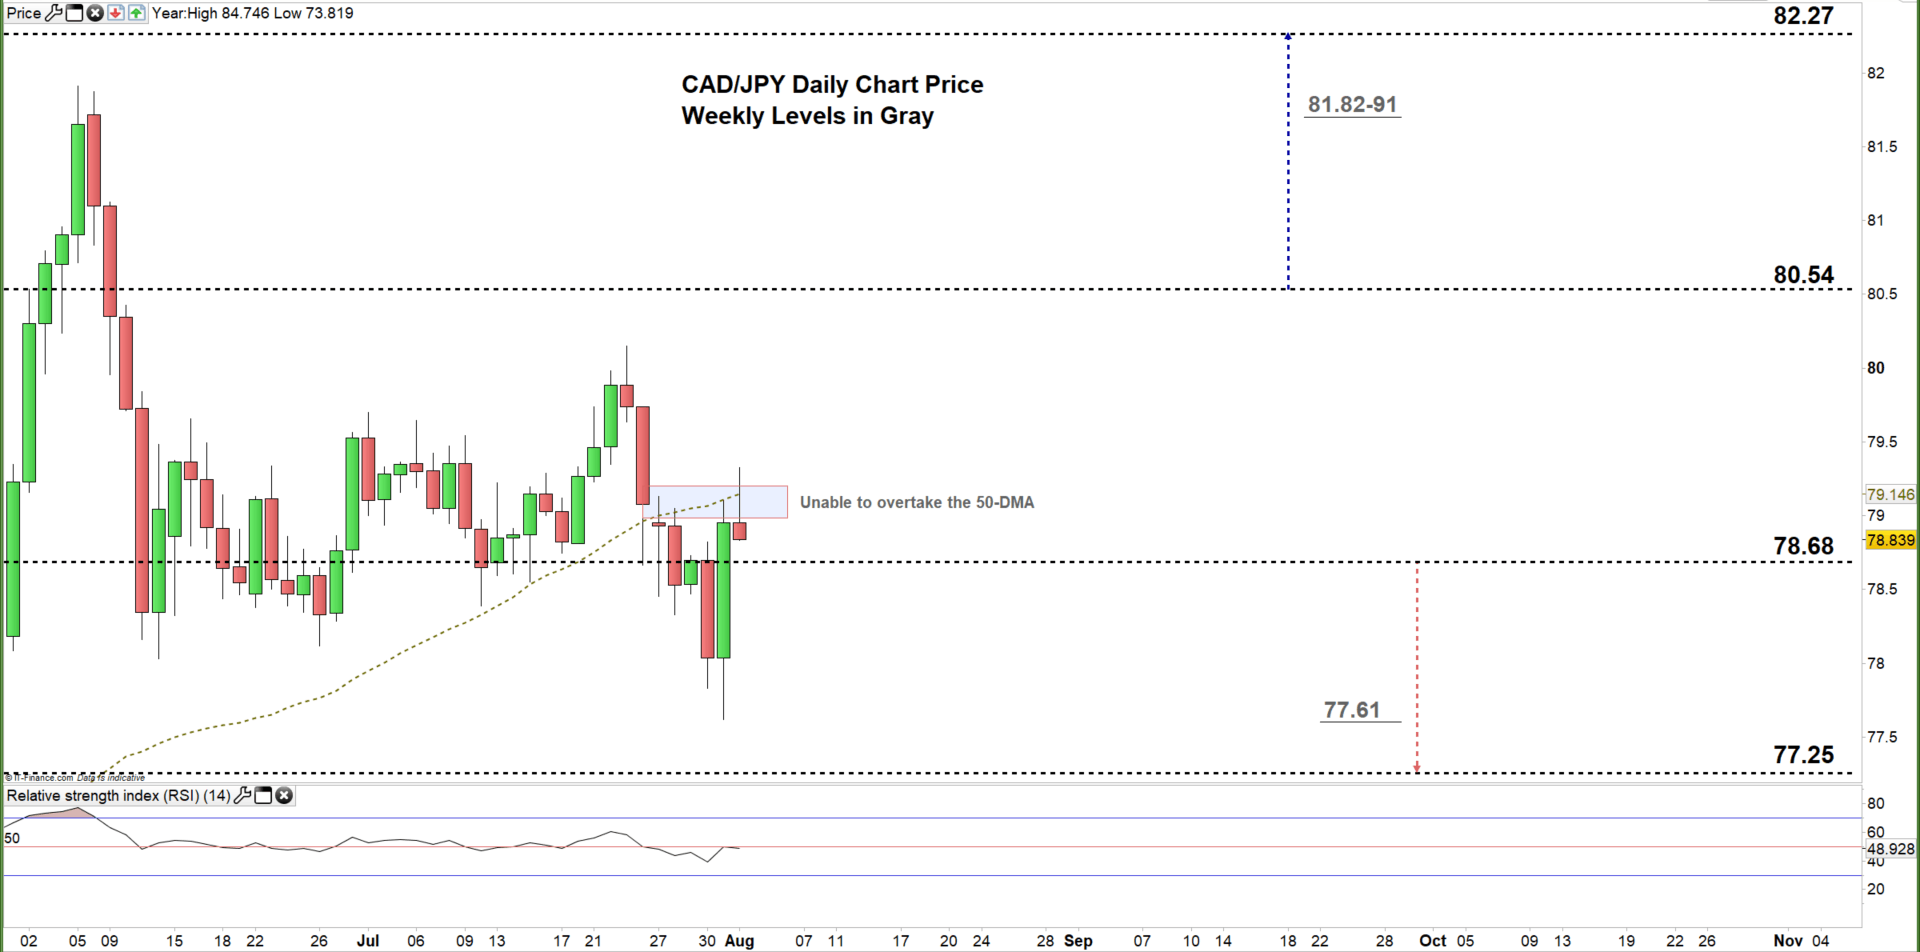
On Friday, CAD/JPY climbed back to the current 78.68 – 80.54 trading zone however, the pair failed to overtake the 50-day moving average indicating that bearish momentum was still intact.
A daily close below the low end of the current trading zone could encourage bears to re-attempt testing the monthly support at 77.25 (December 2011 high).
On the other hand, a failure in closing below the low end of the current zone reflects bear’s hesitation and may trigger a rally towards the high end of the zone (March 2018 low).

CAD/JPY Four Hour PRice CHART (June 10 – AUgust 3, 2020)
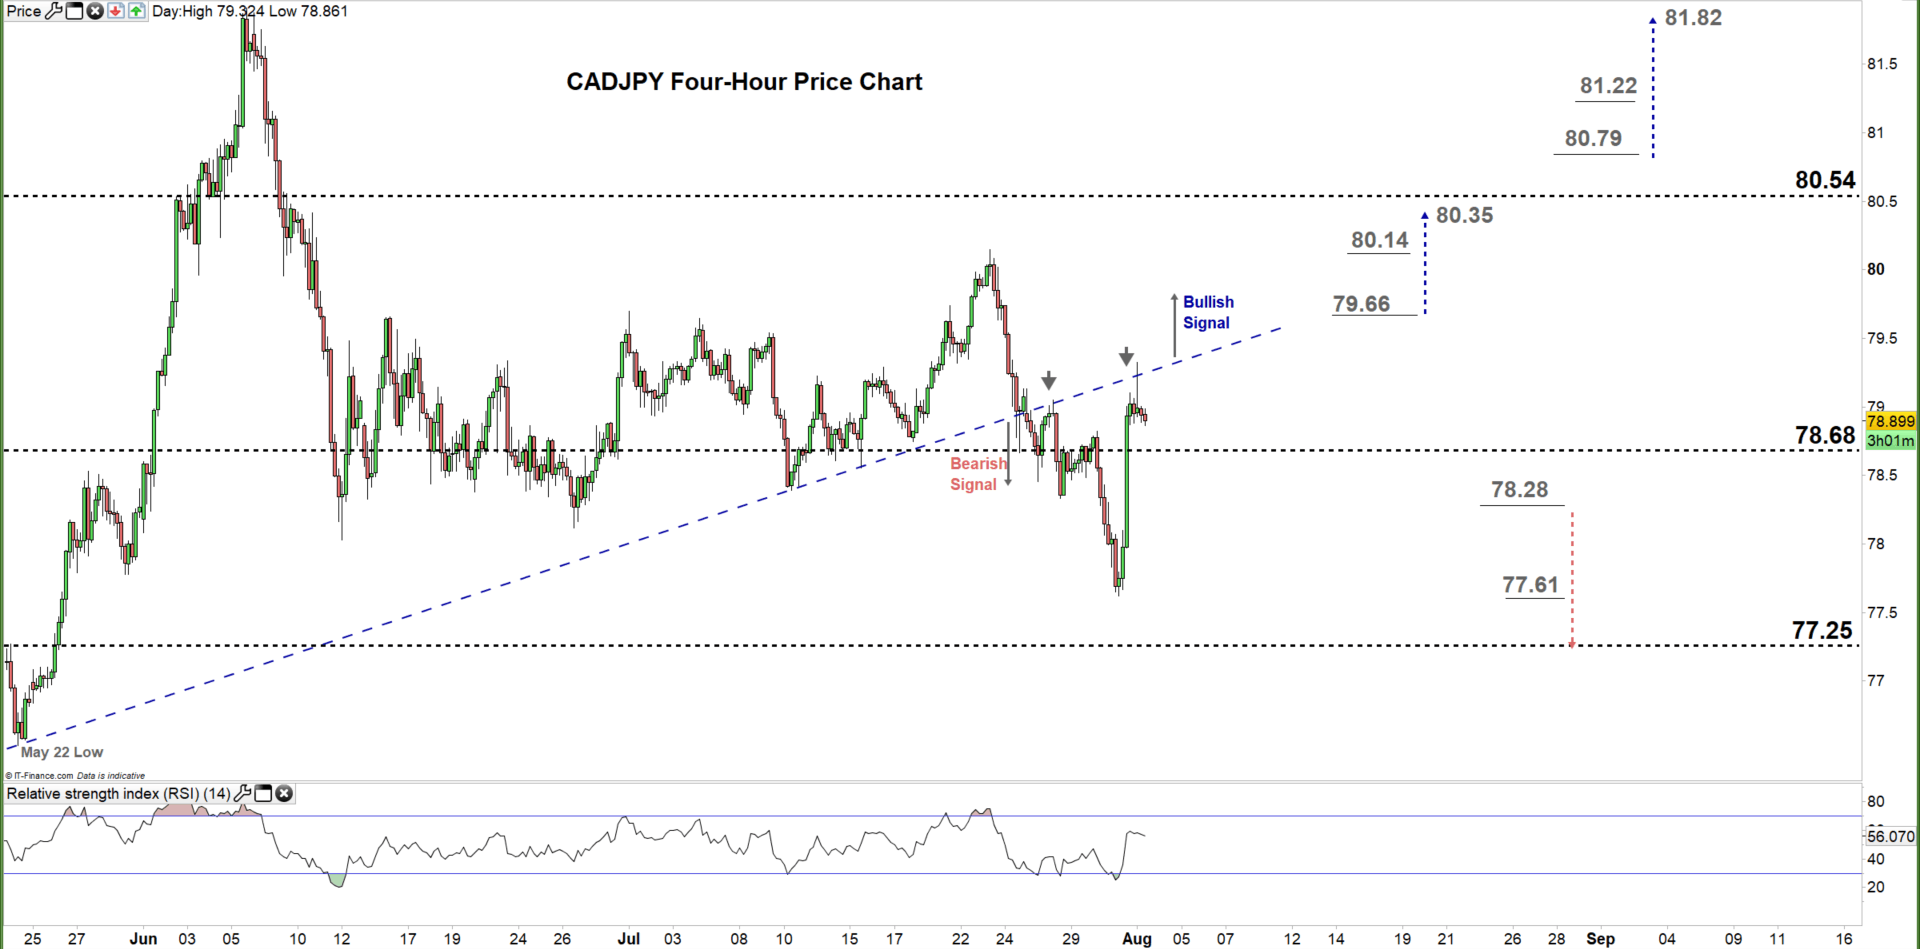
On July 27, CAD/JPY traded below the bullish trendline support originating from the May 22 low at 76.61 indicating a shift in favor of bears control which has thus far held.
To conclude, while bearish bias is still in place a break above the aforementioned bullish trend line resistance may end bull’s control. Therefore, a break above 79.66 may cause a rally towards 80.35, while a break below 78.28 could send CADJPY towards 77.25. As such, the support and resistance levels marked on the four-hour price chart should be watched closely.
Written By: Mahmoud Alkudsi,Market analyst
Please feel free to contact me on Twitter: @Malkudsi


