


CAD Analysis and Talking Points
USD/CAD | Potential Turning Point
Momentum signals continue to highlight that USD/CAD trades with a bearish bias. However, the bearish DMI has eased since the recent peak reached at the beginning of the week, thus potentially signalling that USD/CAD may be susceptible for a bounce back. That said, the ADX trend strength indicator is at the highest level since February (41), however, while this may suggest that the bearish trend may continue, the indicator has rarely held above 40 and subsequently marks the turning point in the pair. Therefore, we await a pullback in the ADX indicator for confirmation that USD/CAD will turn. Alongside this, trendline support stemming from October 2018 low has so far curbed further losses for the pair. Although, in light of a closing break below trendline support, the pair risks a move back towards September lows of 1.3016.
USD/CAD Price Chart: Daily Time Frame (Apr 2019 – Oct 2019)
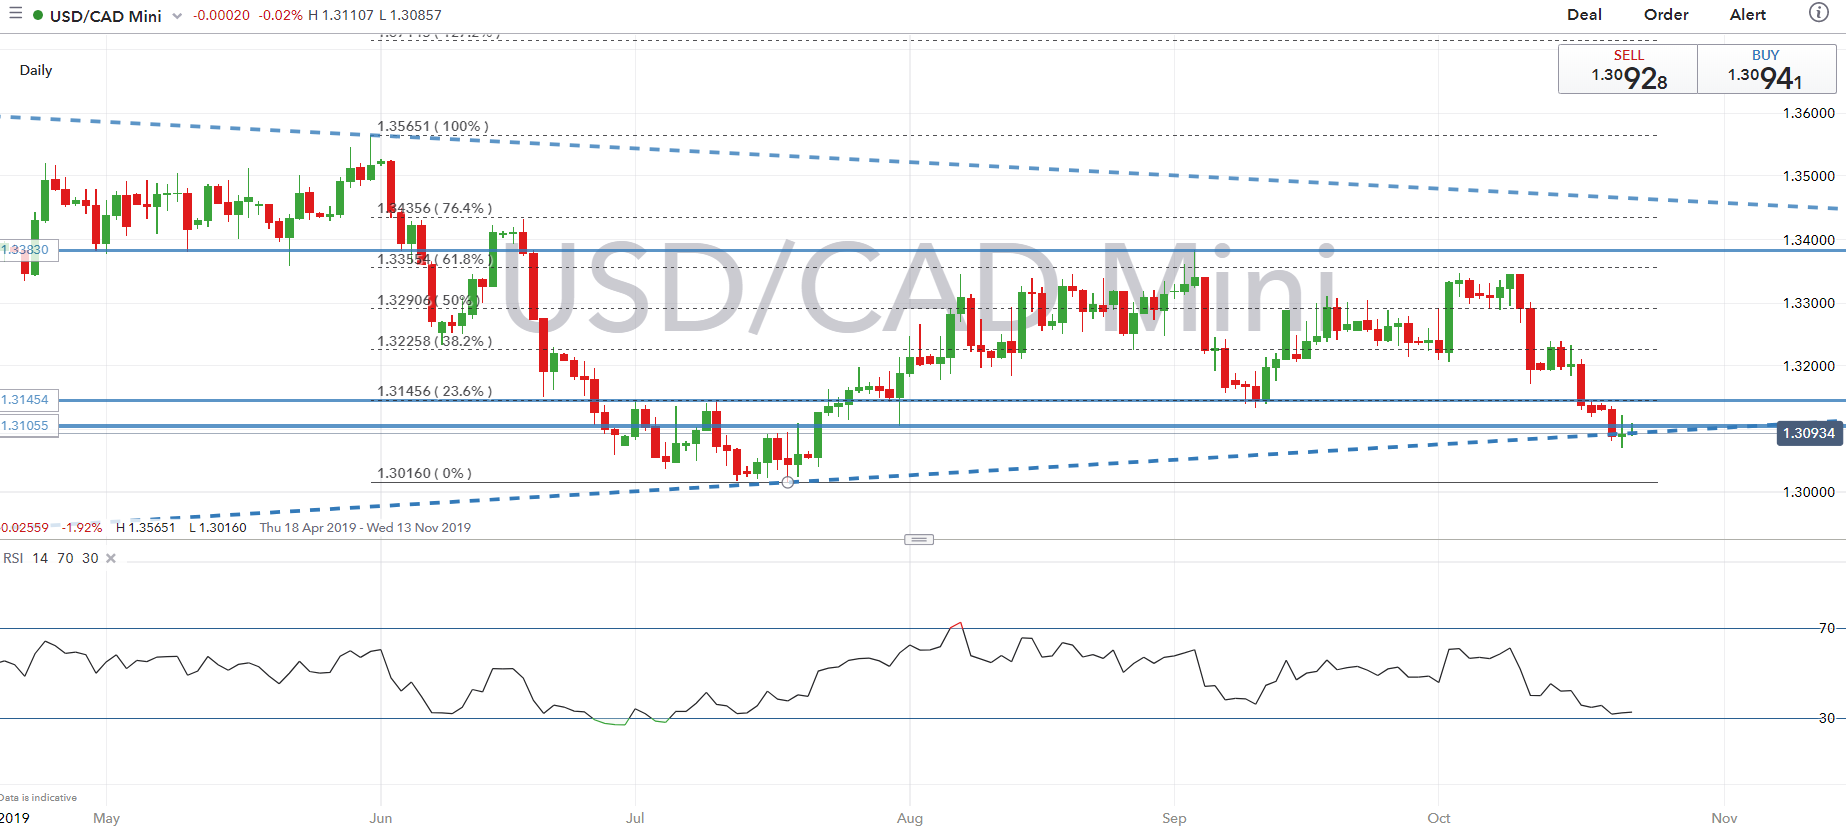
Source: IG Charts
USD/CAD DMIs and ADX (Nov 2017 – Oct 2019)
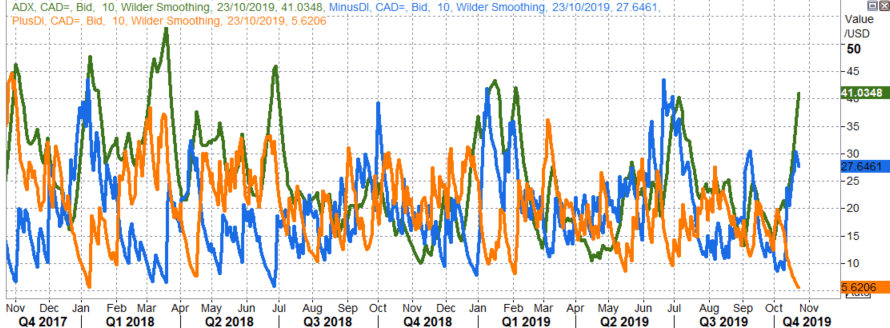
Source: Refinitiv
CAD/JPY | Upside Momentum Exhausted
Following the recent rise in CAD/JPY, signs are beginning to show that the bullish momentum is slowing after the failure to maintain a foothold above the 83.00 handle. However, given that geopolitical risks appear to be easing, dips could potentially meet support from 82.43 (38.2% Fibonacci retracement) and 82.11 (200DMA).
CAD/JPY Price Chart: Daily Time Frame (Sep 2018 –Oct 2019)
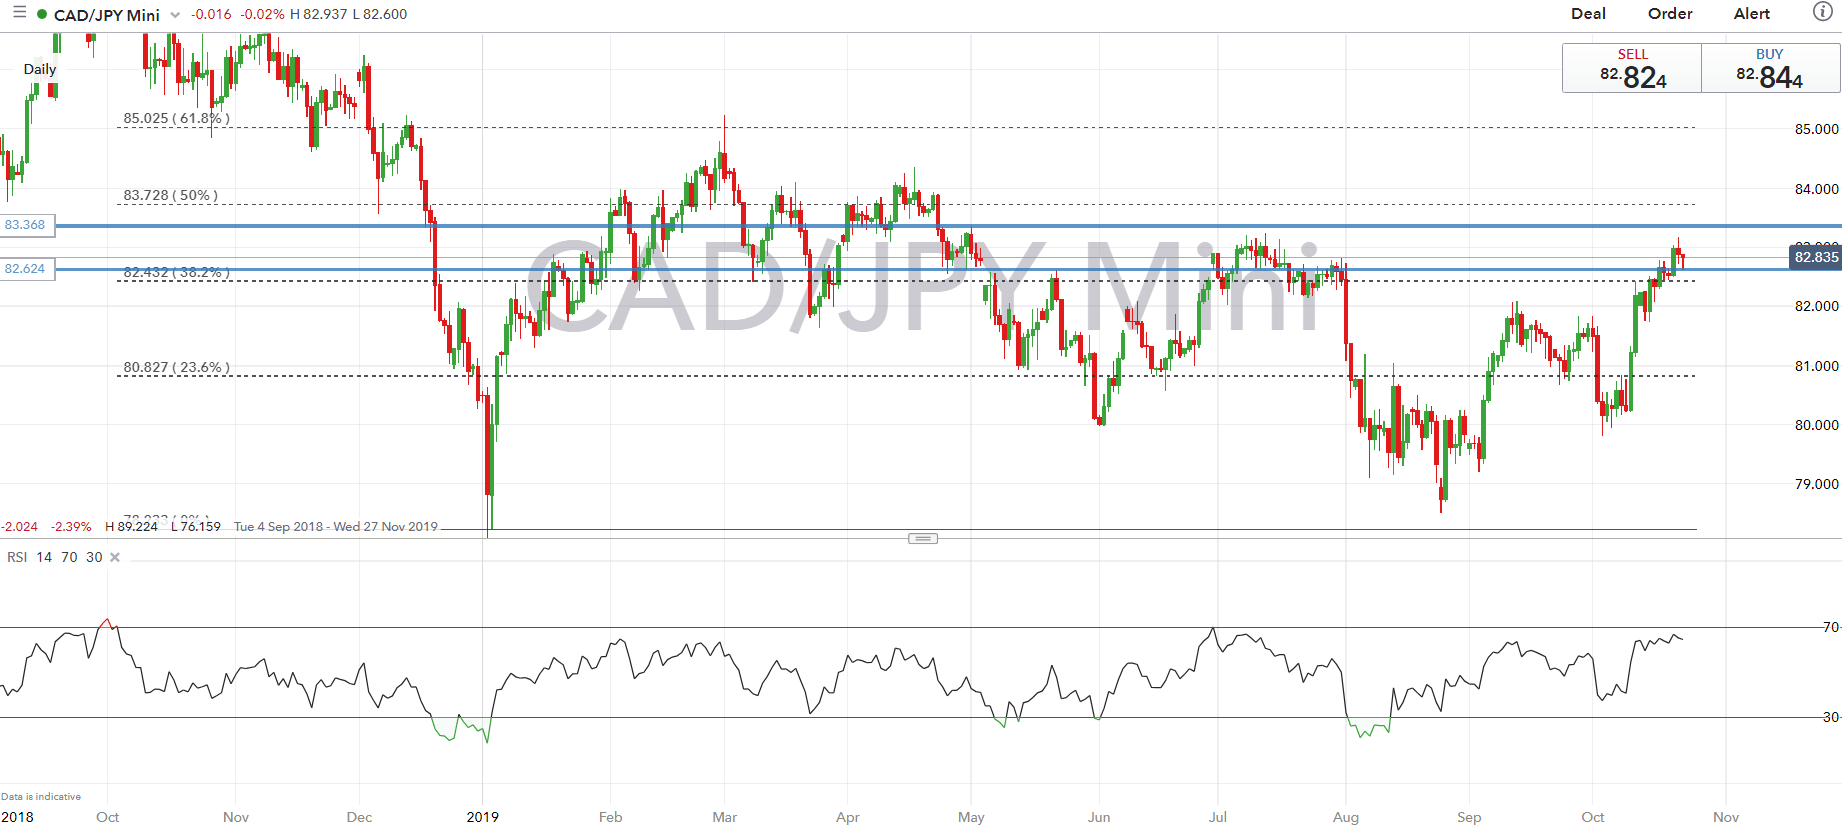
Source: IG Charts
--- Written by Justin McQueen, Market Analyst
To contact Justin, email him at Justin.mcqueen@ig.com
Follow Justin on Twitter @JMcQueenFX


