


CAD Analysis and Talking Points
- USDCAD | Range Respected, However, 1.3520 Break Eyed for Further Upside
- CADJPY | Critical Support Tested, Cross Remains Bearish
See the DailyFX Q2 FX forecast to learn what will drive the currency throughout the quarter.
USDCAD | Range Respected, However, 1.3520 Break Eyed for Further Upside
The pair has continued to respect its well-defined range for the past month, however, as USDCAD tests 1.3520 on the upside, eyes will be on for a firm break if we were to see a 1.36 handle. DMI’s on the daily, weekly and monthly timeframes are bullishly aligned albeit marginally so, which in turn could see buying on dips. On the downside, support is situated at 1.3440, which represents that 61.8% Fib level from the 1.3670-1.3068 drop, while the 50DMA resides 1.3410. For the uptrend to be negated in the short-term eyes will be on for a closing break below 1.3370. Option markets show that the 1-day implied move for USDCAD is at 9.8 vols = 66pip breakeven.
USDCAD PRICE CHART: Daily Time Frame (Dec 2018 – May 2019)

CADJPY | Critical Support Tested, Cross Remains Bearish
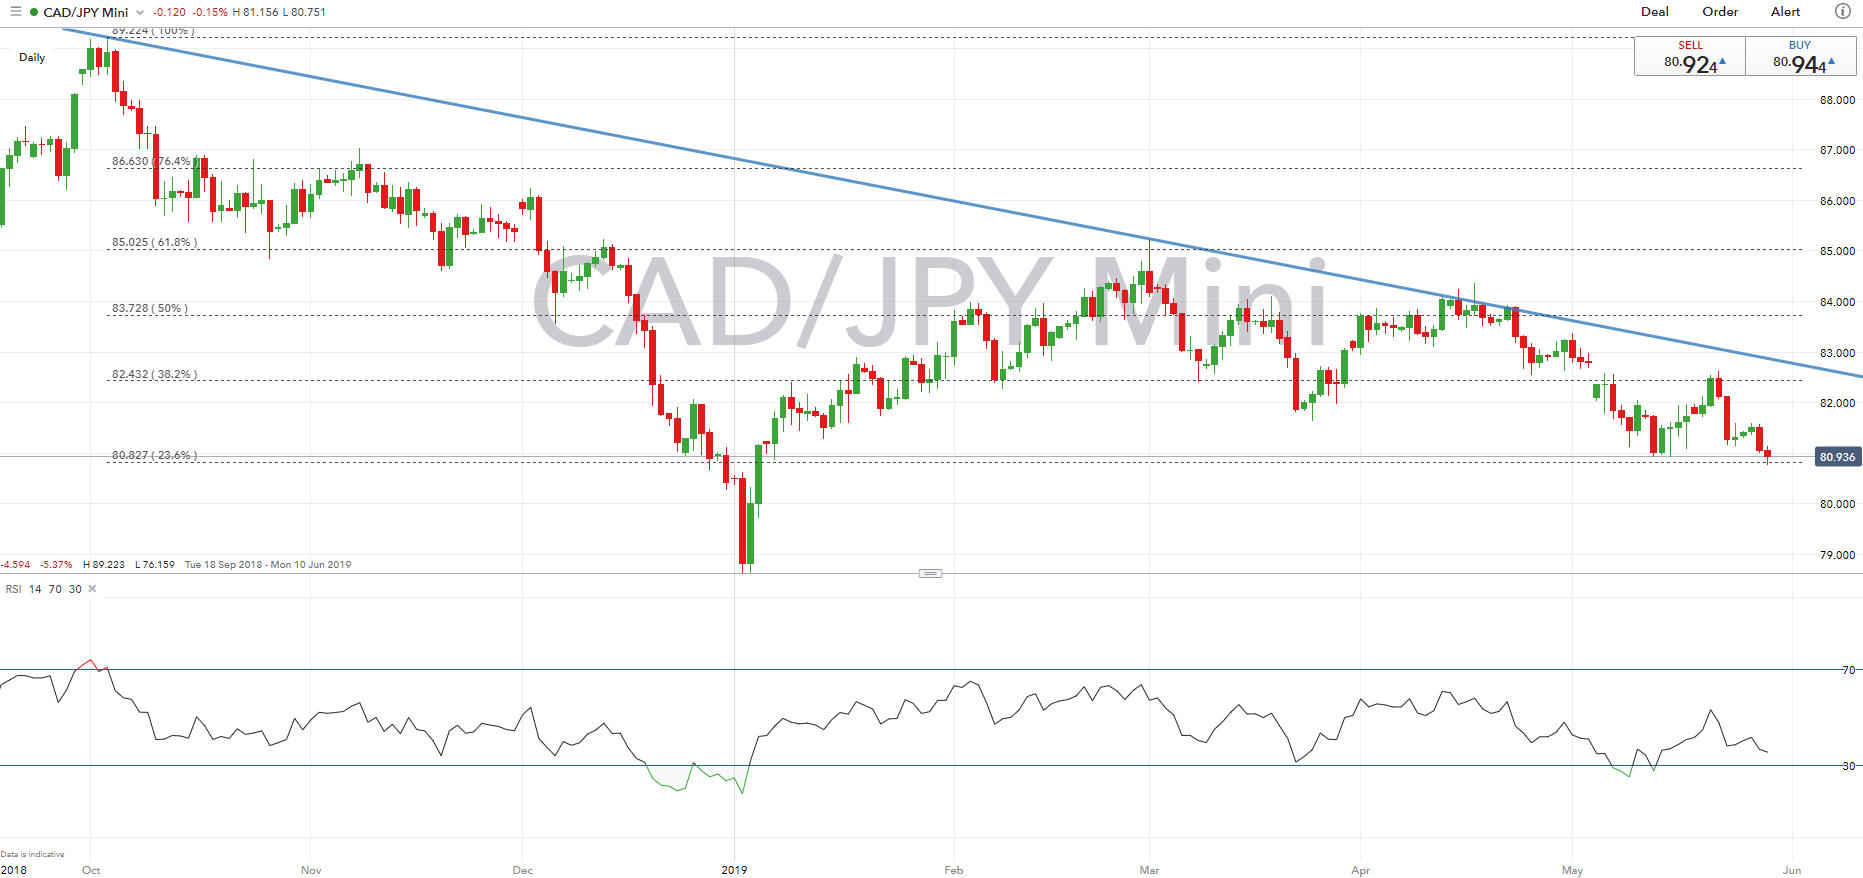
The outlook for the CADJPY continues to remain soft with upticks in the cross relatively short-lived. Momentum indicators on both the short and longer time frames continue to provide a bearish bias and as such, the focus on for a test of key support at 80.83, which represents the 23.6% Fib level. In turn, a closing break below opens up a move towards 80.50.
CADJPY PRICE CHART: Daily Time Frame (Sep 2018 – May 2019)
--- Written by Justin McQueen, Market Analyst
To contact Justin, email him at Justin.mcqueen@ig.com
Follow Justin on Twitter @JMcQueenFX


