


AUD Analysis and Talking Points
- AUDUSD | Downside Momentum Intensifying
- AUDJPY | Bearish Outlook Remains Firm
- GBPAUD | Uptrend Intact, However, Breakout Unlikely in Near-Term
See our Q2 FX forecast to learn what will drive the currency throughout the rest of the year.
AUDUSD | Downside Momentum Intensifying
The bearish momentum continues to intensify as AUDUSD trades at the lowest level since the Jan 3rd flash crash. As the pair broke below the 0.6900 handle, eyes are on for a test of the 2016 low situated at 0.6830, without taking the flash crash spike into consideration, the break below would see AUDUSD trade at the lowest level since the financial crisis. DMIs on the short- and longer-term timeframes (Daily, Weekly and Monthly) signals that risks remain tilted to the downside. As such, any rallies could be capped as markets reload on shorts.
AUDUSD PRICE CHART: Weekly Time Frame (Sep 2015 – May 2019)

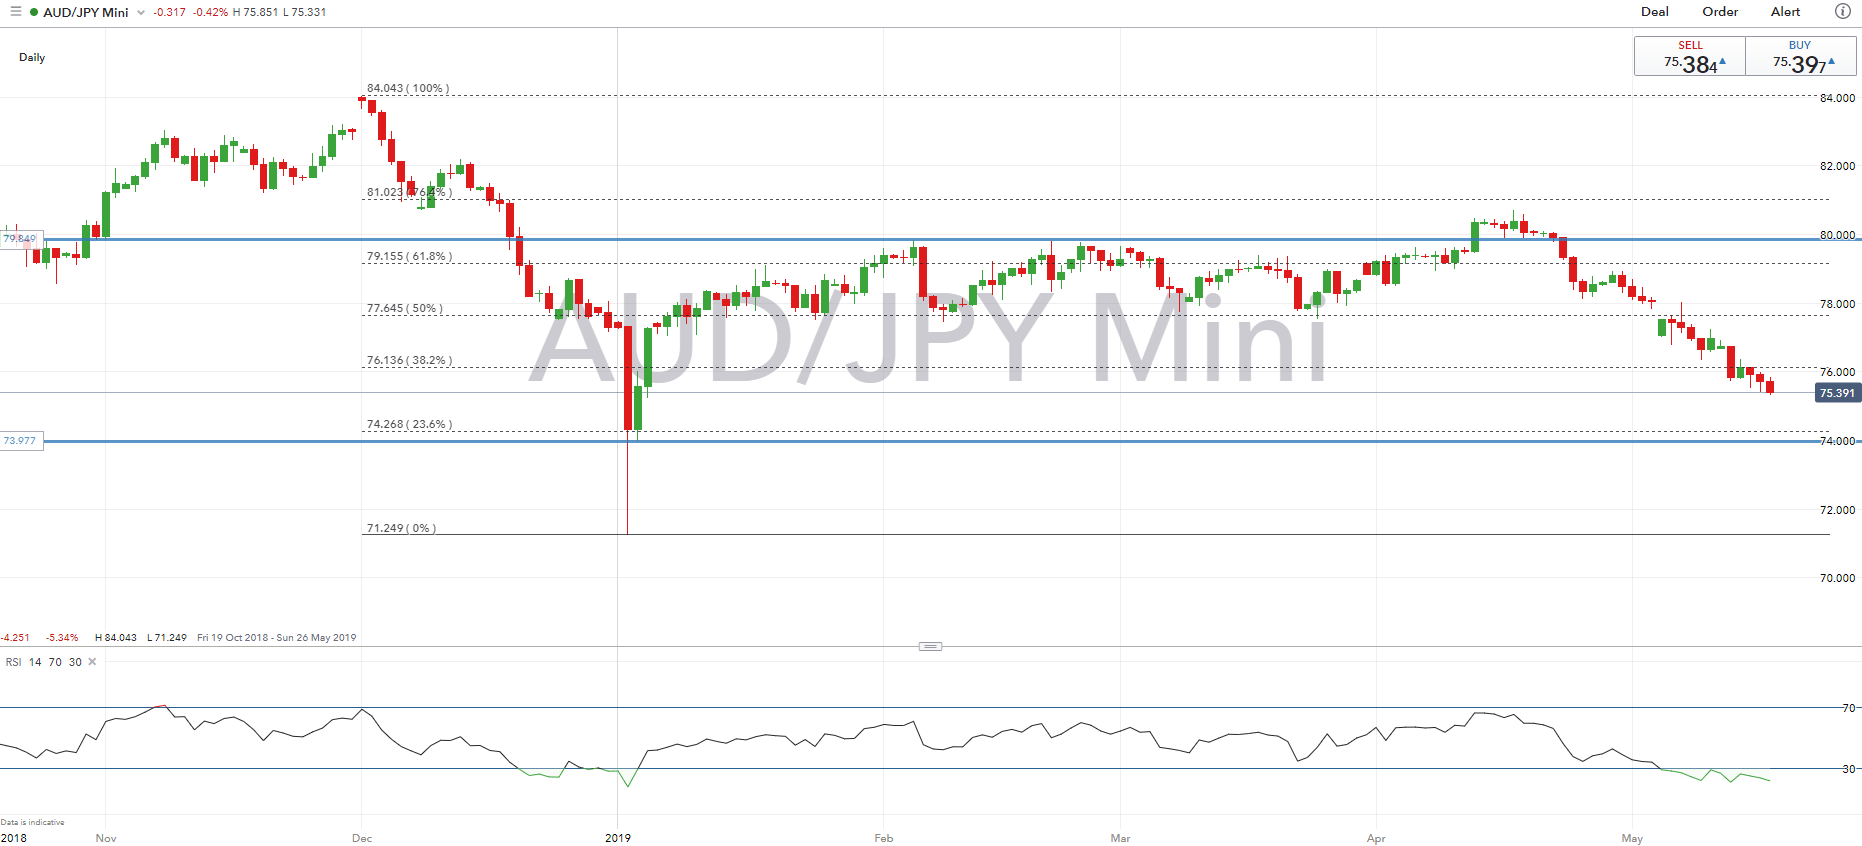
AUDJPY | Bearish Outlook Remains Firm
Another weekly drop in the cross keeps the outlook for the cross weak, while bearish trend signals have also accelerated in recent sessions. AUDJPY risks a move towards the 23.6% Fibonacci retracement situated at 74.26, in which a move below sets the cross on a test of the 74.00 level. However, with the RSI residing in oversold territory, there is a slight risk of a bounce back, although given the overall weak outlook a bounce could be capped at resistance, which comes in the form of the 38.2% Fib (76.13).
AUDJPY PRICE CHART: Daily Time Frame (Oct 2018– May 2019)
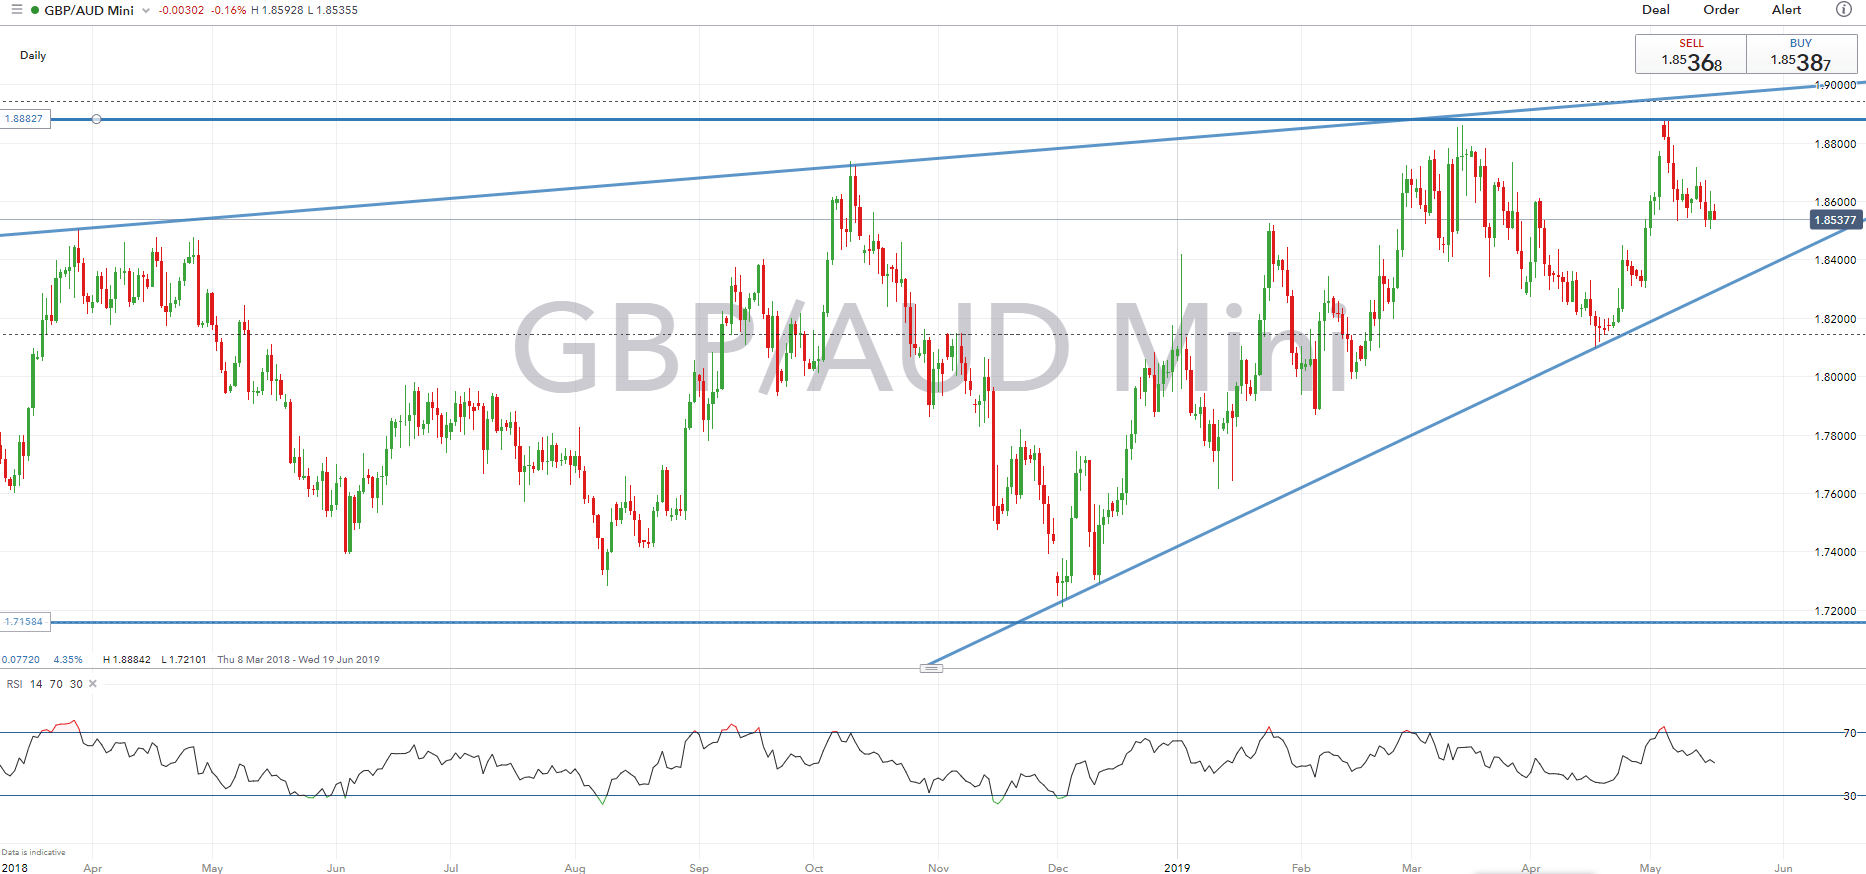
GBPAUD | Uptrend Intact, However, Breakout Unlikely in Near-Term
GBPAUD has continued to keep the uptrend intact with the series of higher highs and higher lows, however, given that both the GBP and AUD are weak currencies, a breakout is unlikely for now. As such, topside resistance at high 1.88s is likely to hold in the short. Alongside this, while DMIs on the daily timeframe continue to tilt towards further upside, this has eased since the May 6th peak. Consequently, the outlook is neutral in the short term.
GBPAUD PRICE CHART: Daily Time Frame (Mar 2018 – Mar 2019)
G10 FX TECHNICAL ANALYSIS OVERVIEW
Canadian Dollar Technical Analysis Overview: USDCAD, CADJPY, AUDCAD
--- Written by Justin McQueen, Market Analyst
To contact Justin, email him at Justin.mcqueen@ig.com
Follow Justin on Twitter @JMcQueenFX


