


CAD Analysis and Talking Points
- USDCAD | Uptrend Intact, 1.3520 Break Needed to Extend Gains
- CADJPY | Bearish Pressure Persists, Key Support in Focus
- AUDCAD | Bearish Trend to Strengthen on Break Through March Lows
See the DailyFX Q2 FX forecast to learn what will drive the currency throughout the quarter.
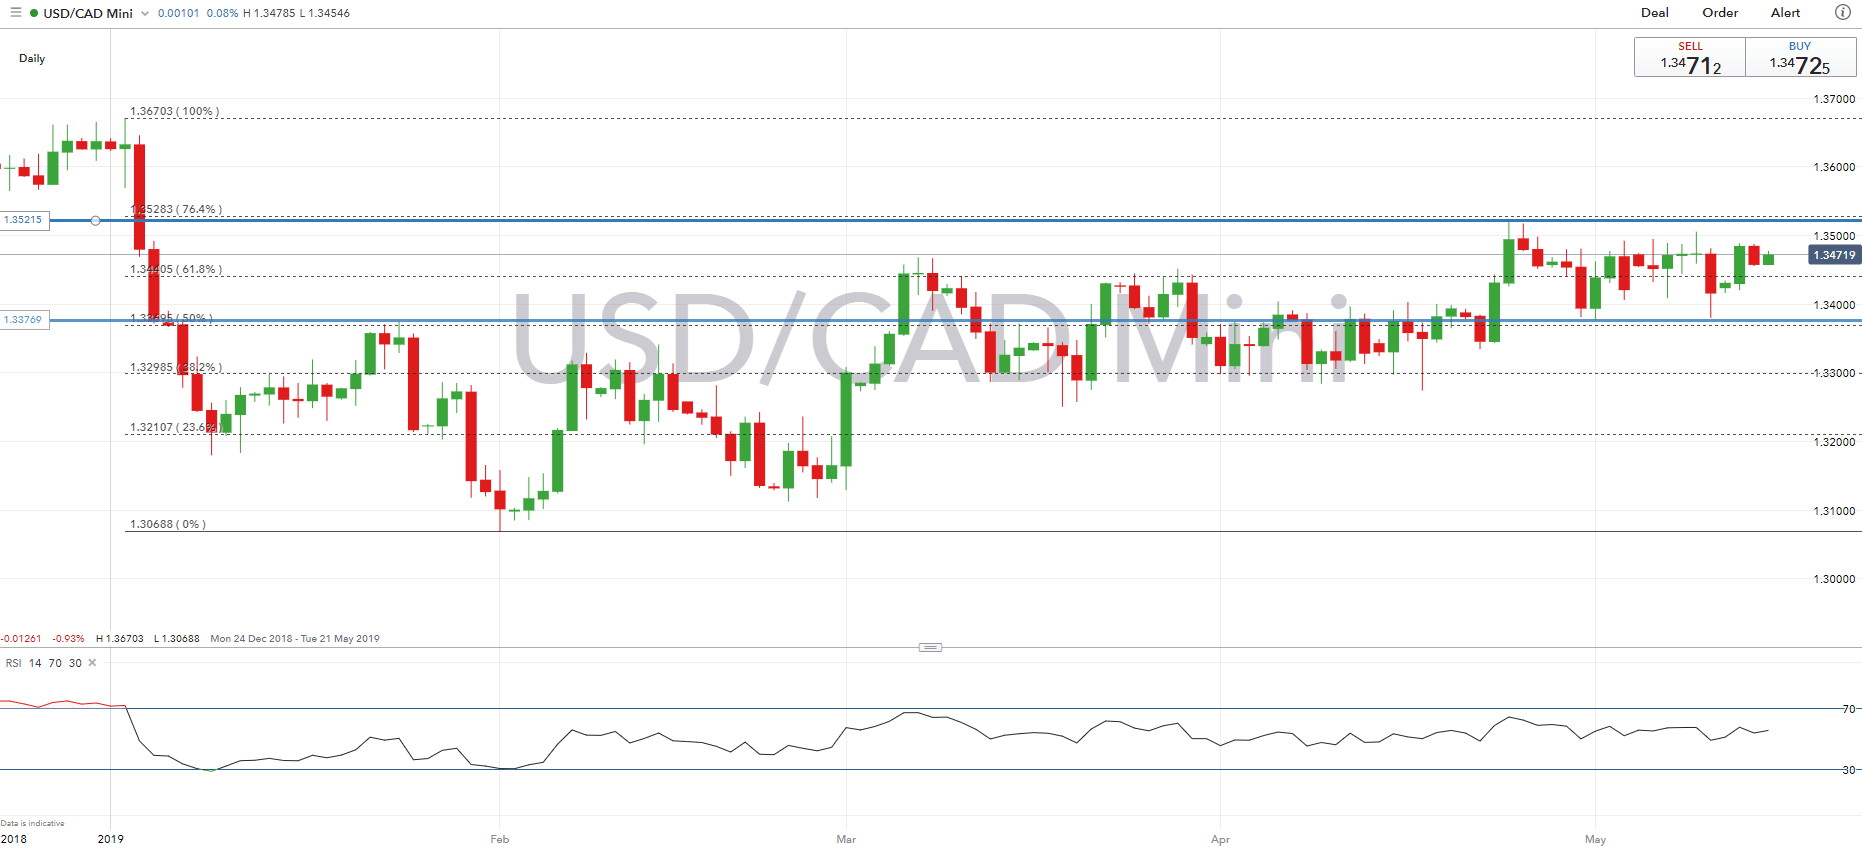
USDCAD | Uptrend Intact, 1.3520 Break Needed to Extend Gains
Despite two consecutive bearish weekly closes, the uptrend for USDCAD remains intact. Last Friday’s drop in the pair had been stalled by support noted last week at 1.3370-80 (full story). USDCAD has since bounced back with the pair edging towards 1.35 yet again. Key resistance however, is situated at 1.3520 whereby a convincing break above would be needed to see the pair at 1.36. Until then, gains could be faded given prior failures to consolidate above 1.35. Alongside this, while DMIs on the daily timeframe tilt towards a bearish bias, a close below 1.3370 would be needed to signal a potential bearish breakout. Option markets show that the 1-day Implied move for the USDCAD = 50pips.
USDCAD PRICE CHART: Daily Time Frame (Dec 2018 – May 2019)
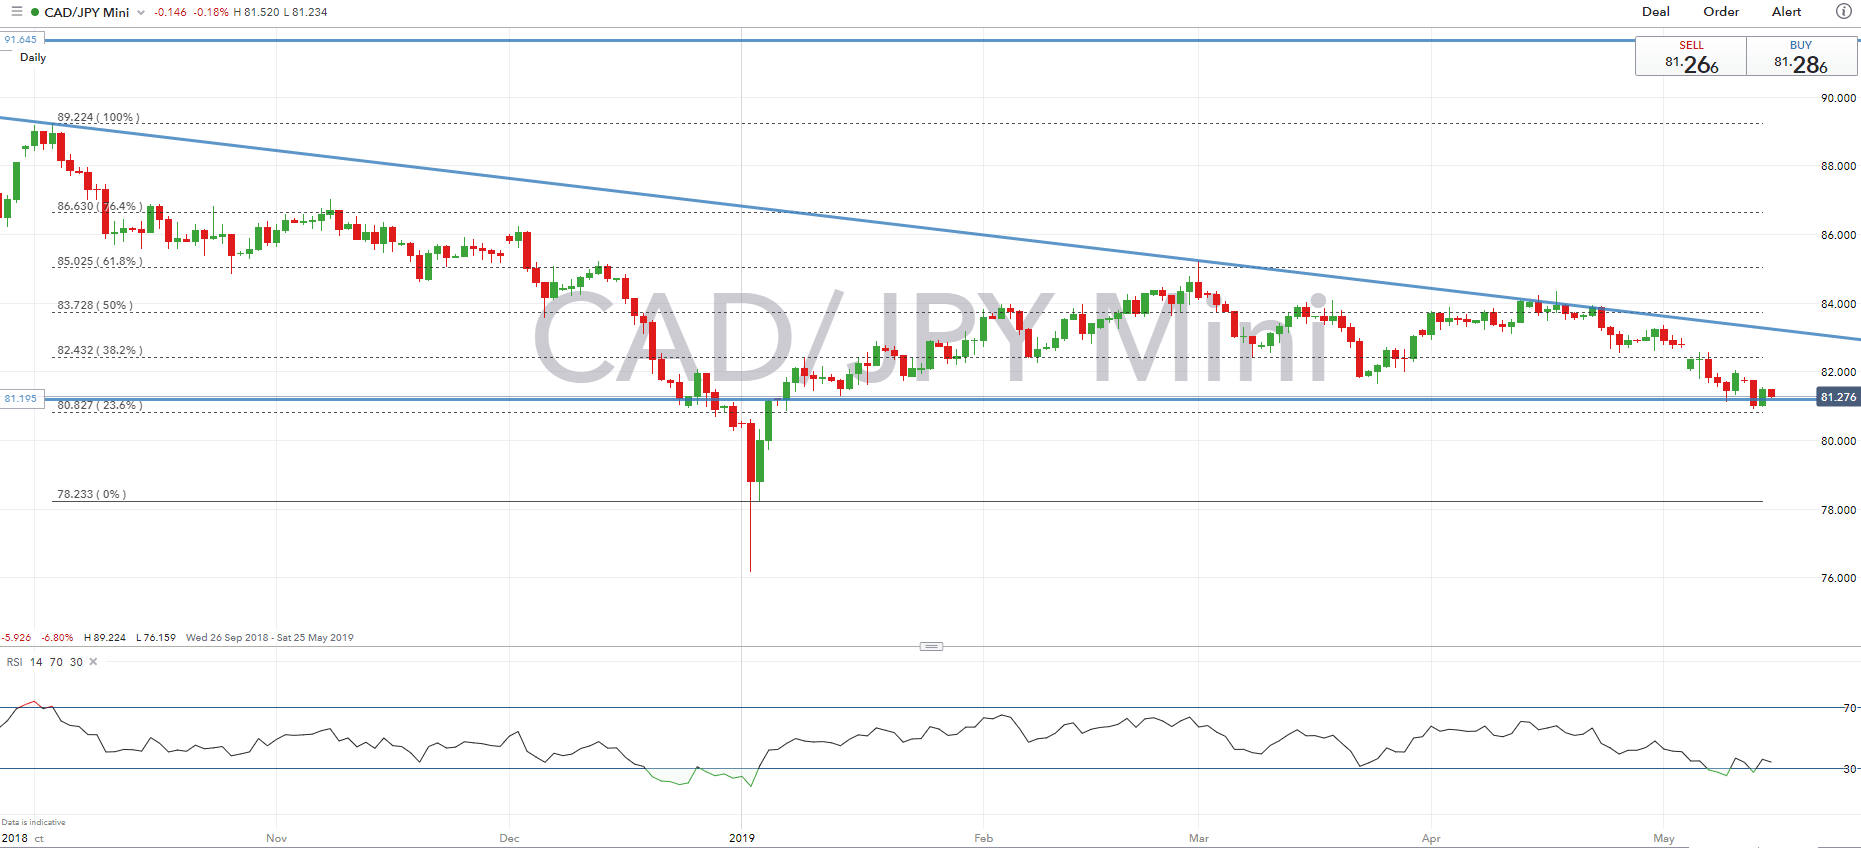
CADJPY | Bearish Pressure Persists, Key Support in Focus
At the back end of last week, the cross saw a mild reprieve, however, with the outlook continuing to remain fragile for CADJPY, the modest gains had been quickly retraced. In turn, CADJPY made a breach below last week’s low (81.09). Given that DMIs on the short and longer time frames continue to tilt to the downside, eyes are on for a test of key support at 80.83 (23.6% Fib retracement), in which a break opens up room for a move towards 80.50.
CADJPY PRICE CHART: Daily Time Frame (Sep 2018 – May 2019)
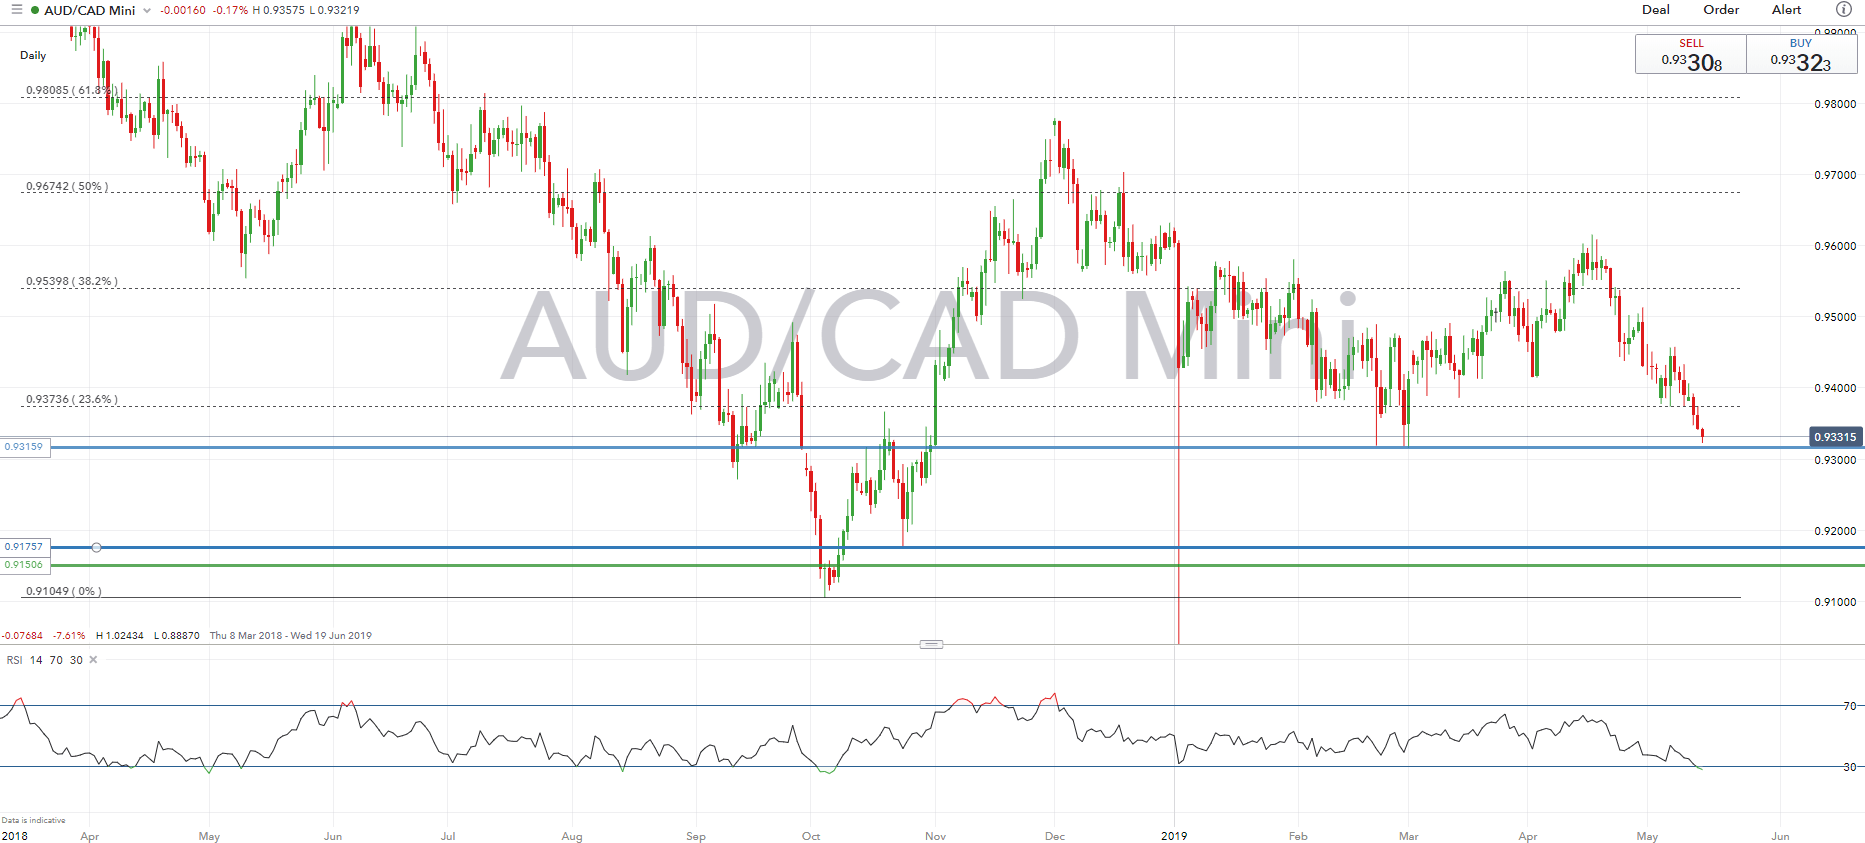
AUDCAD | Bearish Trend to Strengthen on Break Through March Lows
The outlook for AUDCAD has become increasingly bearish in light of the recent escalation in trade war tensions between China and the US. Consequently, the cross is now testing the march low (0.9315), in which a closing break below, increases the risk of a move towards 0.9200. However, with the RSI in oversold territory, there is a risk of a mild reprieve, although gains are likely to be limited below 0.9500-10, while resistance in the short term resides at 0.9373 (23.6% Fibonacci retracement).
AUDCAD PRICE CHART: Daily Time Frame (Mar 2018 – May 2019)
--- Written by Justin McQueen, Market Analyst
To contact Justin, email him at Justin.mcqueen@ig.com
Follow Justin on Twitter @JMcQueenFX


