


GBP Analysis and Talking Points
- GBPUSD | Beware of Exhaustion
- GBPJPY | Key Fibo May Come into Focus
- EURGBP | Topside Resistance to Keep Upside Limited
See our Q1 FX forecast to learn what will drive the currency throughout the rest of the year.
GBPUSD | Key Fibo Holding for Now
GBPUSD has continued to soften since the recent break below the 200DMA. As the pair dips below the 1.29 handle, eyes are now on 1.2890 whereby the 23.6% Fibonacci Retracements resides, which has held thus far. With momentum indicators remaining bearish, a firm break below could see a move towards the low 1.28s with 1.2830 in focus for the next level of support. Topside resistance is situated at 1.2950 in the short.
GBPUSD PRICE CHART: Daily Time Frame (Mar 2018 – Feb 2019)

GBPJPY | Bearish Bias Remains Intact, 1.40 the Near-Term Base
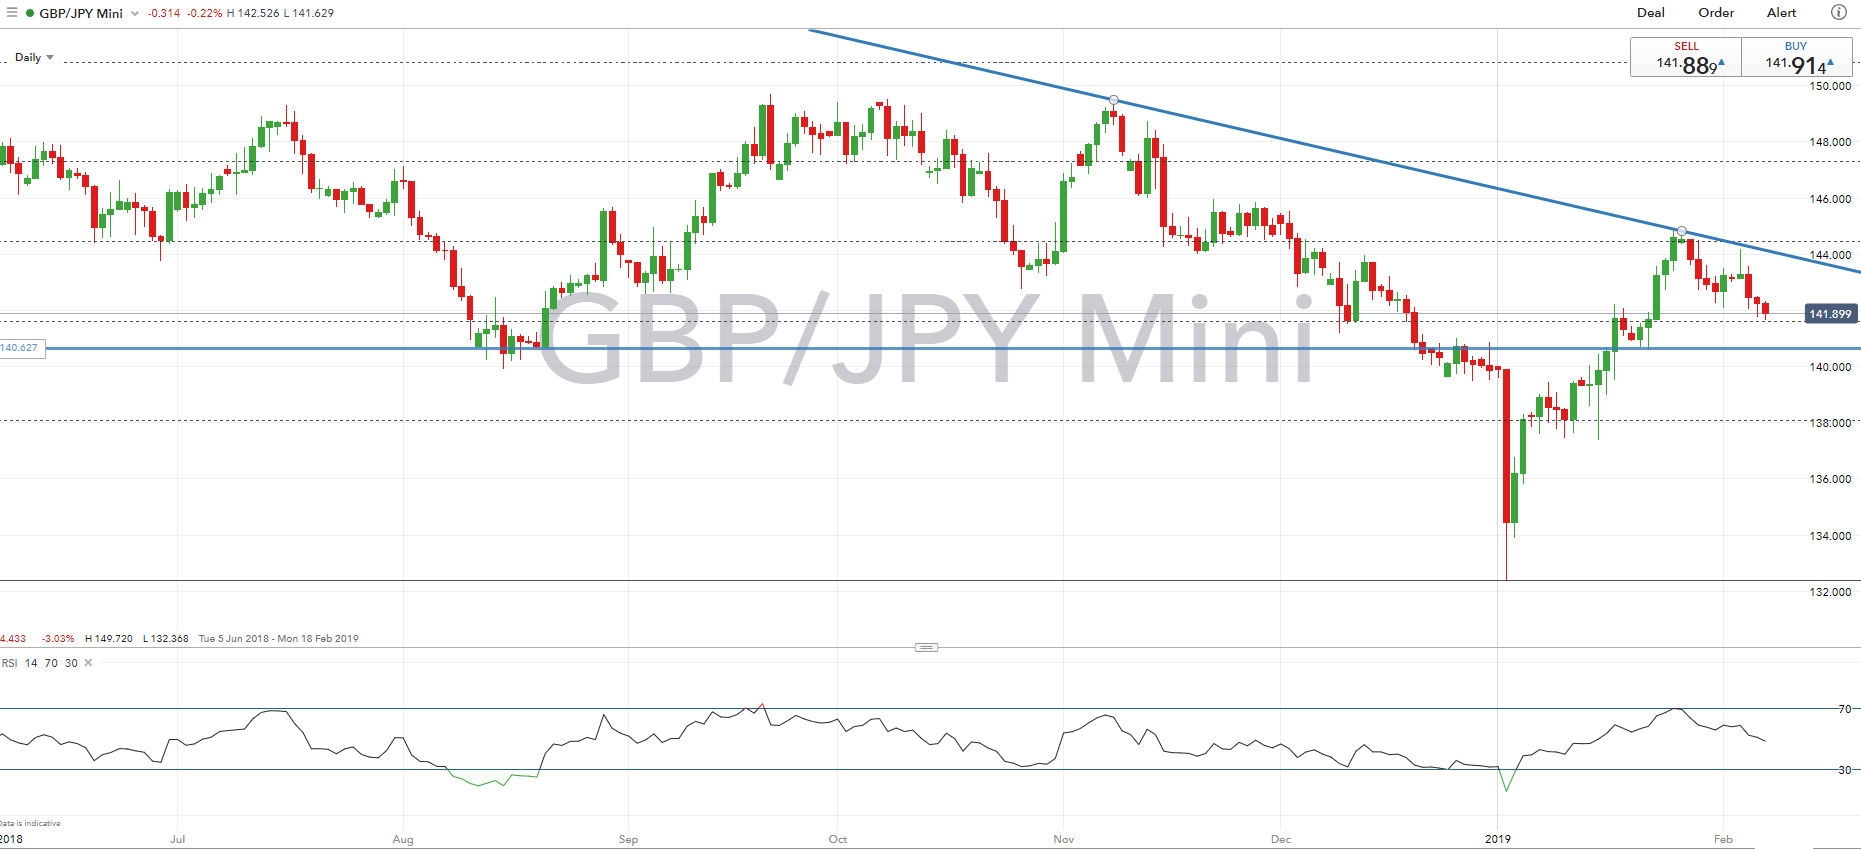
The bias for GBPJPY remains bearish, support at 141.60 is keeping GBJPY afloat for now. However, a clear break could exacerbate a move toward the mid-140s. Momentum indicators keep the outlook bearish albeit this has eased slightly given that DMIs have been choppy as of late. Near-term base is at 1.40, while the outlook for GBPJPY changes on a closing break above the descending trendline.
GBPJPY PRICE CHART: Daily Time Frame (Jun 2018– Feb 2019)
EURGBP | Topside Resistance to Keep Upside Limited
The recent bid in EURGBP beginning to stall with the cross failing to consolidate above 0.8800. Alongside this, topside resistance from 0.8860-0.8900 could also keep upside somewhat limited. As such, a turn in sentiment could see a test of near-term support at 0.8850, in which a break below increases risks of a move towards the low 0.87s.
EURGBP PRICE CHART: Daily Time Frame (Oct 2018 – Feb 2019)

G10 FX Technical Analysis Overview
--- Written by Justin McQueen, Market Analyst
To contact Justin, email him at Justin.mcqueen@ig.com
Follow Justin on Twitter @JMcQueenFX


