


NZD Analysis and Talking Points
- NZDUSD | Key Resistance to Curb Upside
- NZDJPY | Cluster of DMAs Offering Resistance
- AUDNZD | Fibo Support Holding, Downside Momentum Easing
See our Q1Technical FX forecast
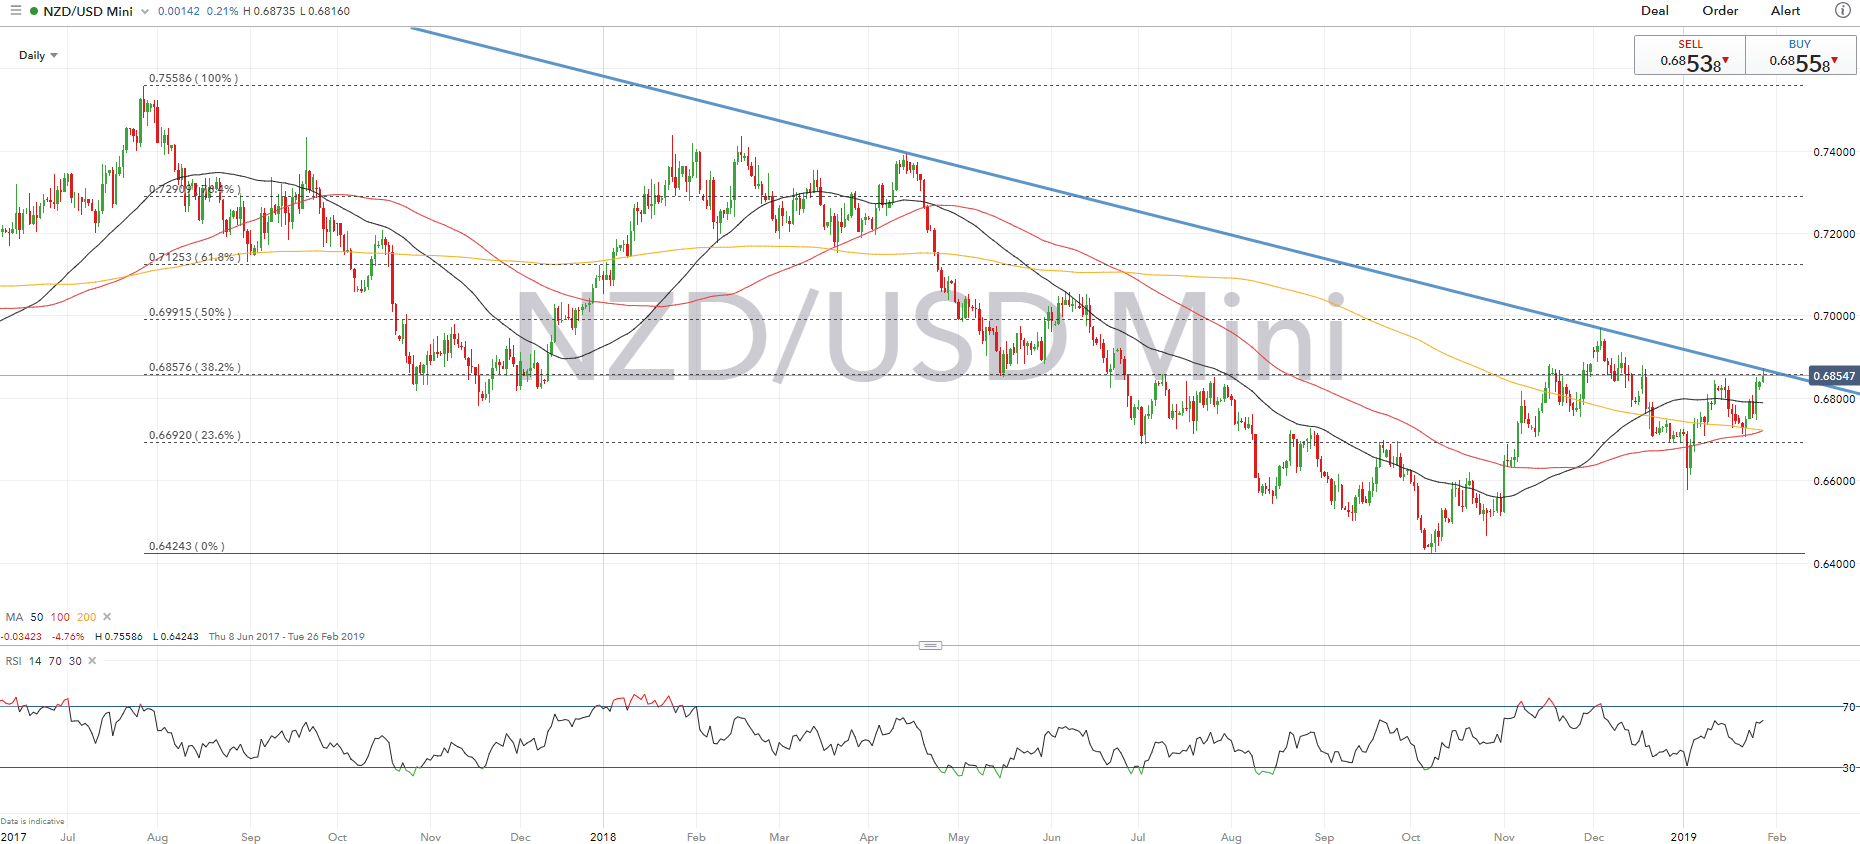
NZDUSD | Key Resistance to Curb Upside
Upside in the pair has once again stalled at the descending trendline from April 2018 peak, which is situated at 0.6870. This also coincides with the 38.2% Fibonacci retracement level (0.6857), offering another layer of resistance for NZDUSD. Consequently, failure to break above, raises scope for a move back towards 0.6700 handle. However, momentum indicators remain somewhat marginally bullish, although, as such, a firm break above key resistance could see 0.7000.
NZDUSD PRICE CHART: Daily Time Frame (Jul 2018 – Jan 2019)
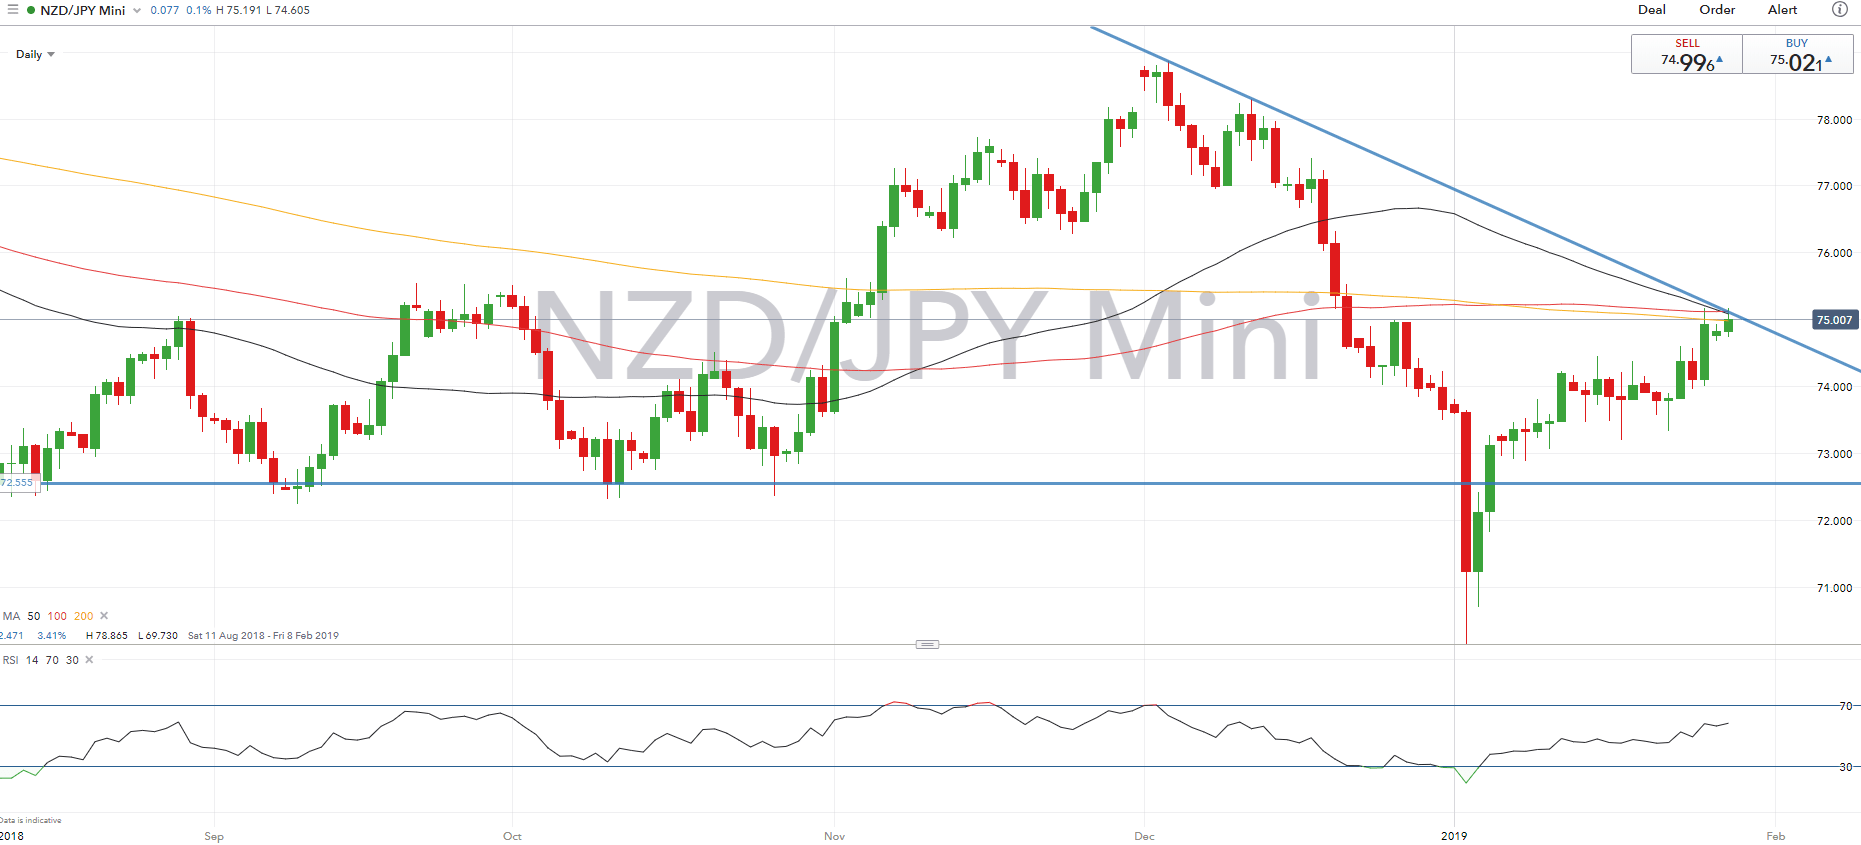
NZDJPY | Cluster of DMAs Offering Resistance
Friday’s breakout of the recent range sees NZDJPY now eyeing a cluster of DMAs from 0.7500-0.7545, which could curb further upside in the cross. Alongside this, bullish momentum indicators have slowed, suggesting that the cross may begin to see a slight pullback.
NZDJPY PRICE CHART: Daily Time Frame (Aug 2018– Jan 2019)
AUDNZD | Fibo Support Holding, Downside Momentum Easing
While momentum indicators suggest that risks remain tilted to further downside, this has somewhat slowed in recent sessions with the 61.8% Fibonacci retracement (1.0470) holding for now. A closing break below however, likely to spark retest of 1.04. Topside resistance is situated at 1.05, where bullish momentum may begin to pick up provided that AUDNZD can sustain a breach through 1.0550 (38.2% Fibonacci retracement).
AUDNZD PRICE CHART: Daily Time Frame (Nov 2018 – Jan 2019)

KEY RESOURCES FOR FOREX TRADERS
Whether you are a new or experienced trader, we have several resources available to help you; indicator for tracking trader sentiment, quarterly trading forecasts, analytical and educational webinars held daily, trading guides to help you improve trading performance, and one specifically for those who are new to forex.
--- Written by Justin McQueen, Market Analyst
To contact Justin, email him at Justin.mcqueen@ig.com
Follow Justin on Twitter @JMcQueenFX


