


Talking Points:
- EUR/USD trades between 200, 500 day moving averages ahead of FOMC
- A hawkish Fed could weigh on the pair for more downside conviction
- EUR/USD Volatility measures extremely subdued
The EUR/USD has found support around the last Daily swing low and its 200-day SMA to start the trading day, as the pair continues its predominate sideways trading movement ahead of today’s key event risk.
The Fed Rate Decision is the huge event in front of us, and the FOMC outlook could shape the trend in the weeks (perhaps months) ahead.
Against this backdrop we will form our outlook and look to find short term trading opportunities using different tools such as the Grid Sight Index (GSI) indicator.
Click Here for the DailyFX Calendar
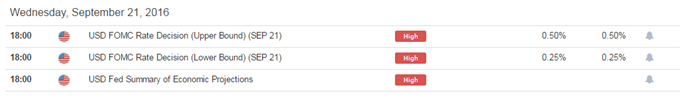
The FOMC Rate Decision is to hit the wires at 18:00 GMT, followed by a speech by Fed Chair Jennet Yellen shortly after.
Markets are pricing in a 22% probability of a hike in today’s decision, meaning that a shock hike will catch most participants off-guard, implying significant US Dollar strength.
Indeed, while a surprise hike is less likely, there is a case to be made for the Fed to move at this meeting, going against market expectations in the short term to gain credibility for the long game, after Fed members leaned to the hawkish side in recent weeks.
If the fed hikes or goes on a hawkish hold signaling a December move, economic projections could indicate a downgrade to the rates path going forward, potentially limiting fallout in risk assets.
Taken together, risks seem skewed for US Dollar strength on a hawkish Fed, but even a slight dovish lean could see the US Dollar tumble.
EUR/USD Technical Levels:

Click here for the DailyFX Support & Resistance tool
We use volatility measures as a way to better fit our strategy to market conditions. The Euro is expected to be less volatile versus the US Dollar than most other majors based on implied volatility measures (only the Swiss Franc less), and 20-day ATR readings as well suggest an extremely subdued levels of realized volatility.
In turn, this may imply that the market is not expecting any major swings here, suggesting macro levels could hold if the Fed acts in line with expectations.
EUR/USD 30-Min Chart (With the GSI Indicator): September 21, 2016

(Click to Enlarge)
The EUR/USD is trading around potential resistance at 1.1150, with GSI calculating higher percentages of past movement to the upside in the short term from current levels.
The GSI indicator above calculates the distribution of past event outcomes given certain momentum patterns. By matching events in the past, GSI describes how often the price moved in a certain direction.
You can learn more about the GSI here.
Other resistance levels to watch in the short term might be 1.1180, 1.1200, 1.1220 and 1.1250.
Levels of support may be 1.1125, 1.1100, 1.1070 and the 1.1050 level.
We generally want to see GSI with the historical patterns significantly shifted in one direction, which alongside a pre-determined bias and other technical tools could provide a solid trading idea that offer a proper way to define risk.
We studied over 43 million real trades and found that traders who successfully define risk were three times more likely to turn a profit.
Read more on the “Traits of Successful Traders” research.
Meanwhile, the DailyFX Speculative Sentiment Index (SSI) is showing that about 49.0% of traders are long the EUR/USD at the time of writing, after trades cut shorts rapidly on the latest decline.
You can find more info about the DailyFX SSI indicator here
--- Written by Oded Shimoni, Junior Currency Analyst for DailyFX.com
To contact Oded Shimoni, e-mail oshimoni@dailyfx.com
Follow him on Twitter at @OdedShimoni


