


Talking Points:
- USD/CAD trading near range resistance at 1.3200
- Further gains might require continued slide in stocks and crude oil prices
- EIA crude oil inventory data in focus for the pair today
The USD/CAD is nudging lower today, alongside rising stocks and crude oil prices, after the pair surged higher as bonds and equities sold off worldwide.
As it were, further momentum seems likely to require another push to risk averse behavior, which puts the spotlight on the EIA crude oil inventory data for the pair today.
Against this backdrop we will form our outlook and look to find short term trading opportunities using different tools such as the Grid Sight Index (GSI) indicator.
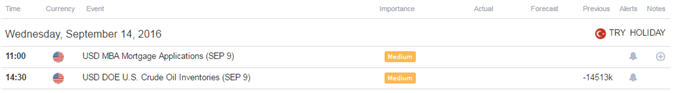
Click Here for the DailyFX Calendar
The official EIA weekly Crude Oil Inventories figure is the main economic indicator of note in an otherwise quiet US economic calendar. Economists are expecting a gain of 2.77 million barrels versus the prior -1.451 million contraction.
Crude Oil and USD/CAD 20-day correlation is sitting at -0.57 while 10-day correlation is lower implying that correlation has eased lately, as the US Dollar gained strength on the backdrop of rising Fed rate hike bets accompanied with a peculiar bonds and equities joint sell-off.
Indeed, safe haven flows and the prospects of higher yields are seemingly a major contribution for the US Dollar’s strength as of late.
If crude oil manages to break below 45$, and equities continue to sell off, the US Dollar may find strength versus its Canadian counterpart.
This makes the EIA data later on quite interesting to watch for a potential spark of volatility for the pair.
USD/CAD Technical Levels:

Click here for the DailyFX Support & Resistance tool
We use volatility measures as a way to better fit our strategy to market conditions. The Canadian Dollar is seeing an uptick in 1-week and 1-month implied volatility measures, and realized volatility is starting to pick up as well based on 20-day ATR readings.
With that said, the pair might need to see a break out from its upper range before the “floodgates open”.
In turn, this might suggest that range bound trading plays might be appropriate ahead, but traders should stay alert to the unfolding situation in bonds and equities, with a potential push from crude oil prices as well.
USD/CAD 30-Min Chart (With the GSI Indicator): September 14, 2016

(Click to Enlarge)
The USD/CAD is trading above potential support at 1.3150, with GSI calculating higher percentages of past movement to the upside in the short term.
The GSI indicator above calculates the distribution of past event outcomes given certain momentum patterns. By matching events in the past, GSI describes how often the price moved in a certain direction.
You can learn more about the GSI here.
Other support levels to watch in the short term might be 1.3112, 1.3080, 1.3050 and 1.3000.
Levels of resistance may be 1.3200, the area below 1.3250, 1.33 and 1.3336.
We generally want to see GSI with the historical patterns significantly shifted in one direction, which alongside a pre-determined bias and other technical tools could provide a solid trading idea that offer a proper way to define risk.
We studied over 43 million real trades and found that traders who successfully define risk were three times more likely to turn a profit.
Read more on the “Traits of Successful Traders” research.
Meanwhile, the DailyFX Speculative Sentiment Index (SSI) is showing that about 37.2% of traders are long the USD/CAD at the time of writing, most short since the January top, offering a long bias on a contrarian basis.
With that said, traders have been generally accurate picking tops and bottoms in the pair lately, as range bound trading plays are associated with retail traders more profitable periods. Taking this into consideration might imply that waiting for the breakout before initiating longs might be appropriate for now.
You can find more info about the DailyFX SSI indicator here
--- Written by Oded Shimoni, Junior Currency Analyst for DailyFX.com
To contact Oded Shimoni, e-mail oshimoni@dailyfx.com
Follow him on Twitter at @OdedShimoni


