


Talking Points:
- AUD/USD finds support below 0.7650 after forming a daily bearish pattern
- RBA minutes ahead are in focus and could provide further information on rate outlook
- AUD/USD may remain supported if low volatility continues as yield differentials prevail
The AUD/USD has found support below the 0.7650 level (at the time of writing) after the pair formed a bearish daily technical pattern implying that a possible top might be forming.
Looking ahead, RBA meeting minutes and low levels of volatility are the major market themes for the pair in the short term, potentially highlighting the relatively attractive Aussie yield.
Against this backdrop we will form our outlook and look to find short term trading opportunities using different tools such as the Grid Sight Index (GSI) indicator.

Click Here for the DailyFX Calendar
The Reserve Bank of Australia (RBA) August Meeting Minutes take center stage for the pair to start the trading week.
In their latest rate decision, the RBA opted to cut the cash rate to 1.50% from the prior 1.75%, in order to assist inflation returning to target.
The Aussie saw an initial decline but quickly found support to initiate a surprising rate cut rally as we suspected.
The central bank said in their policy statement that lower interest rates likelihood of exacerbating risks in housing has diminished, possibly implying that the minutes could further highlight this point and push forward RBA rate cut bets, and the AUD/USD lower.
With that said, if the dynamic of the market not buying into central bank dovishness continues (see the RBNZ rate cut rally), the Aussie might find support relatively quickly, as it did in the rate statement itself, as even a 1.25% yield may look attractive in the current environment (further assisted by reduced volatility-see volatility remarks below).
AUD/USD 10-Min GSI Chart: August 15, 2016

The AUD/USD is trading around possible resistance at 0.7674 at the time of writing (see chart below), with GSI calculating significantly higher percentage of past movement to the downside in the short term.
The GSI indicator above calculates the distribution of past event outcomes given certain momentum patterns. By matching events in the past, GSI describes how often the price moved in a certain direction.
You can learn more about the GSI here.
AUD/USD Technical Levels:

Click here for the DailyFX Support & Resistance tool
We use volatility measures as a way to better fit our strategy to market conditions. The market is seeing extremely low levels of volatility with measures such as VIX hitting their lowest levels in two years.
Indeed volatility is suggesting a relaxed attitude in spite of significant shocks to the market, and an overall ‘summer lull’, with depressed volatility seems to be assisting the AUD/USD to stay bid at the moment.
20-day correlation between the AUD/USD and the VIX (inverted) has picked up recently, and is currently sitting at 0.50.
The low volatility environment might be assisting the Aussie as risks of severe depreciation subside, highlighting intrinsic yield benefits.
In turn this may imply that range bound trading plays might be appropriate at the moment, but caution is warranted on the event risk ahead from Australia and the US.
AUD/USD 30-Min Chart: August 15, 2016
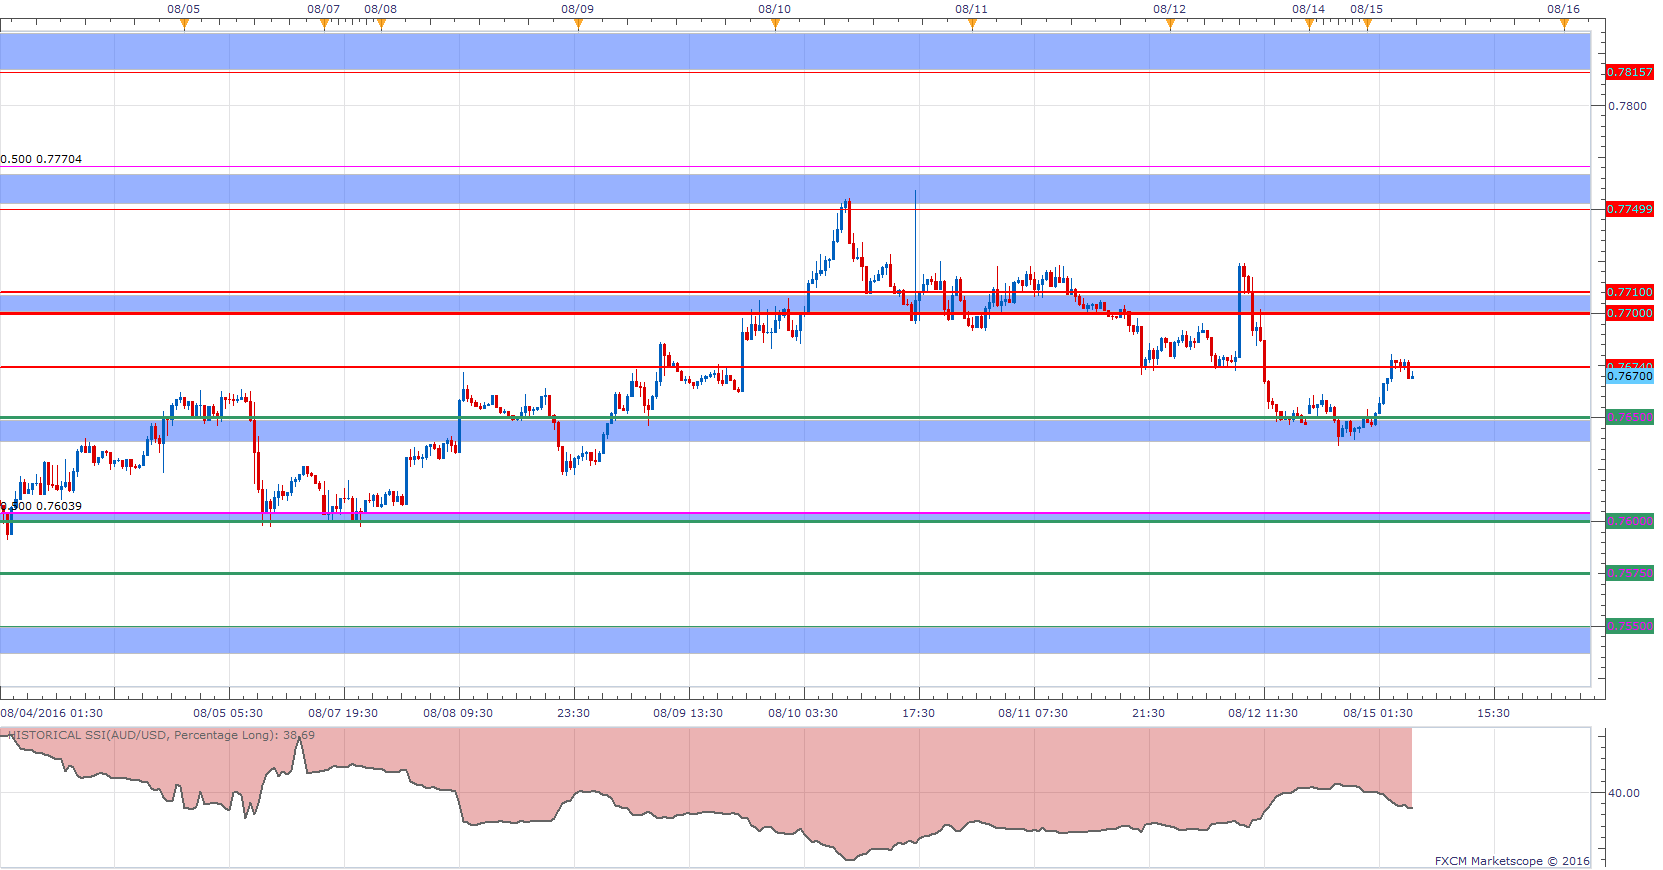
(Click to Enlarge)
The AUD/USD is trading near potential resistance at the 0.7674 level.
Other levels of resistance might be the zones above 0.77 and 0.7750 followed by the 0.78 handle and an area above 0.7815.
Levels of support on a move lower may be the area below 0.7650, 0.7600, 0.7575 and an area below 0.7550.
When price reaches those levels, short term traders might use different technical tools and the GSI to view how prices reacted in the past given a certain momentum pattern.
We generally want to see GSI with the historical patterns significantly shifted in one direction, which alongside a pre-determined bias and other technical tools could provide a solid trading idea that offer a proper way to define risk.
We studied over 43 million real trades and found that traders who successfully define risk were three times more likely to turn a profit.
Read more on the “Traits of Successful Traders” research.
Meanwhile, the DailyFX Speculative Sentiment Index (SSI) is showing that about 38.7% of traders are long the AUD/USD at the time of writing, on the wrong side of the move higher. The SSI is mainly used as a contrarian indicator implying a long bias.
You can find more info about the DailyFX SSI indicator here
--- Written by Oded Shimoni, Junior Currency Analyst for DailyFX.com
To contact Oded Shimoni, e-mail oshimoni@dailyfx.com
Follow him on Twitter at @OdedShimoni


