


Talking Points:
- USD/CAD found support at the 1.30 figure again
- A quiet economic docket and “summer lull” may keep the pair contained at the moment
- Crude Oil correlation with the Canadian Dollar might be back in focus in current trading conditions
The USD/CAD gave back all gains from Friday’s upbeat US NFP report, but the pair did manage to find support (again) at the big 1.30 handle, with the push higher further assisted by a sharp decline in Crude Oil prices on the latest inventories data.
Correlation between the USD/CAD and Crude Oil prices has been reduced lately on intrinsic US Dollar volatility, but the current trading environment might shift focus back to Crude Oil for direction, while reduced volatility may contain the pair within its range.
Against this backdrop we will form our outlook and look to find short term trading opportunities using different tools such as the Grid Sight Index (GSI) indicator.

Click Here for the DailyFX Calendar
A quiet economic calendar today with “second-tier” data might provide little conviction, adding to the overall ‘summer lull’, with depressed volatility.
US Initial Jobless Claims is expected to print 265K from the prior 269K print, while the year-on-year Canadian HPI figure is set to be released at the same time, with the prior number sitting at 2.7%.
With that said, it seems that it would take a significant deviation from expectations for the figures to really see the pair swinging, an environment that could potentially shift focus to Crude Oil prices for short term directional cues.
Crude Oil and USD/CAD 30-day correlation is sitting at -0.70 while 10-day correlation is at +0.16 at the time of writing. These figures might help shed light on the current dynamic in the pair. On the short end, the pair has swung alongside intrinsic US Dollar moves on shifting Fed rate hike speculation, but correlation remains strong on the longer outlook.
With that said, the pair did spike higher on Crude Oil Inventories numbers yesterday, further assisting the rebound from the round 1.30 figure.
In the current trading environment, with major central banks meetings in the rearview mirror, focus may now start to shift more to Crude Oil prices as a major market theme and a directional cue for short term USD/CAD traders.
USD/CAD 10-Min GSI Chart: August 11, 2016
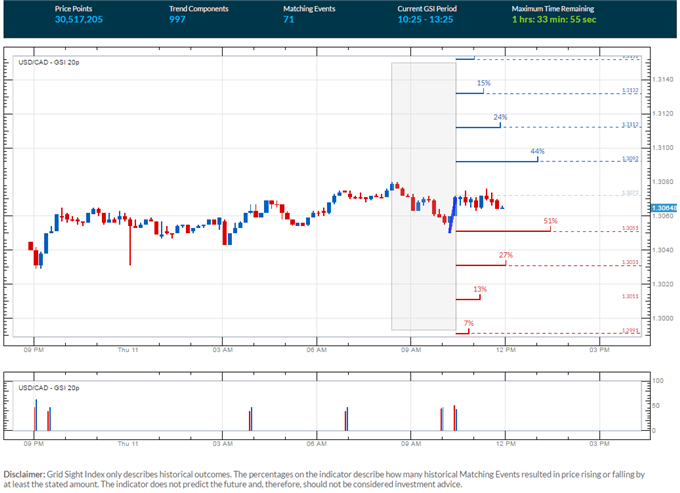
The USD/CAD is trading around an area of resistance above the 1.3070 level at the time of writing (see chart below), with GSI calculating about even percentage of past movement to either side in the short term.
The GSI indicator above calculates the distribution of past event outcomes given certain momentum patterns. By matching events in the past, GSI describes how often the price moved in a certain direction.
You can learn more about the GSI here.
USD/CAD Technical Levels:

Click here for the DailyFX Support & Resistance tool
We use volatility measures as a way to better fit our strategy to market conditions. The USD/CAD is seeing reduced levels of volatility (on 20-day ATR study). Combined with the aforementioned considerations this could imply that range bound trading plays might be appropriate.
USD/CAD 30-Min Chart: August 11, 2016
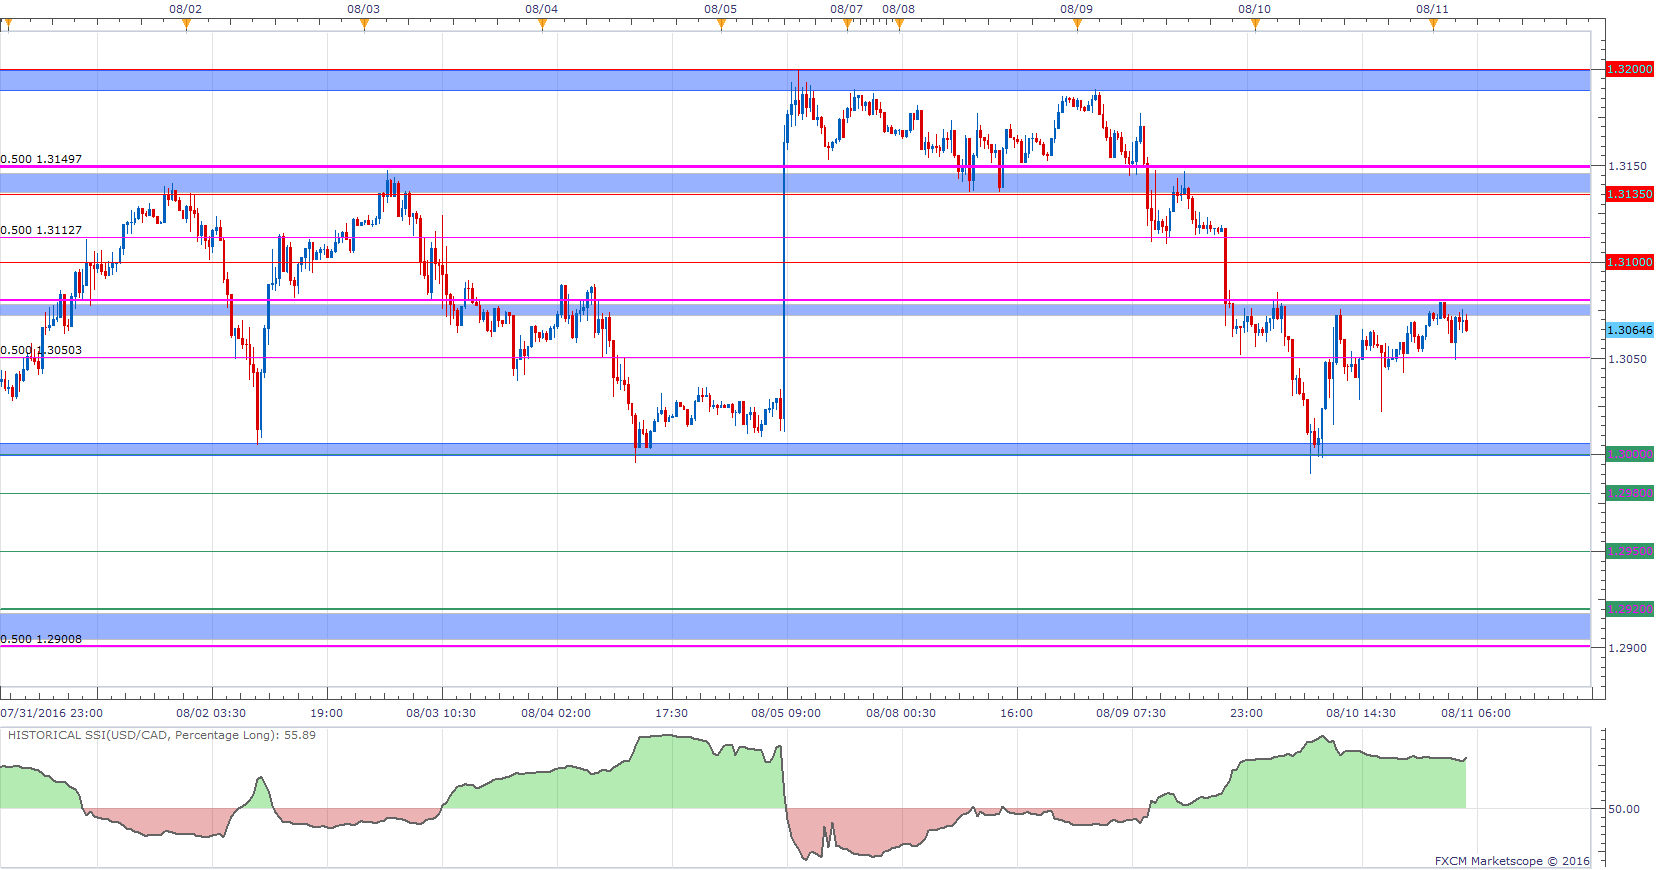
(Click to Enlarge)
The USD/CAD is being contained below an area of resistance above the 1.3070 level at the time of writing. A break higher could expose possible resistance levels at the 1.31 handle, 1.3112, an area below 1.3150 and a zone below 1.32.
Levels of support on a move lower may be 1.3050, the 1.30 area, 1.2980 and 1.2950.
A clear break from either 1.32 or 1.30 could prove significant.
When price reaches those levels, short term traders might use different technical tools and the GSI to view how prices reacted in the past given a certain momentum pattern.
We generally want to see GSI with the historical patterns significantly shifted in one direction, which alongside a pre-determined bias and other technical tools could provide a solid trading idea that offer a proper way to define risk.
We studied over 43 million real trades and found that traders who successfully define risk were three times more likely to turn a profit.
Read more on the “Traits of Successful Traders” research.
Meanwhile, the DailyFX Speculative Sentiment Index (SSI) is showing that about 55.8% of traders are long the USD/CAD at the time of writing. The SSI is mainly used as a contrarian indicator, but range bound trading conditions are usually associated with retail traders more successful periods implying a slight long bias.
You can find more info about the DailyFX SSI indicator here
--- Written by Oded Shimoni, Junior Currency Analyst for DailyFX.com
To contact Oded Shimoni, e-mail oshimoni@dailyfx.com
Follow him on Twitter at @OdedShimoni


