


Talking Points:
- Crude oil prices sink after EIA reports inventory build
- Gold prices continue to tread water near chart support
- Headline sensitivity high amid scheduled event risk lull
Crude oil prices swooned after EIA inventories data showed stockpiles unexpectedly grew by 1.06 million barrels last week, clashing with forecasts calling for a drawdown of 1.5 million barrels. The build was foreshadowed in the API inventories estimate published yesterday.
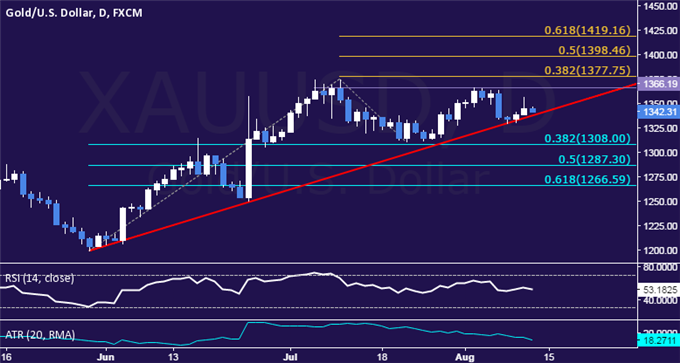
Meanwhile, gold prices continue to tread water after sinking in the wake of a better-than-expected US jobs report released on Friday. Prices attempted a recovery amid broad-based US Dollar weakness in the early hours of yesterday’s session but follow-through failed to impress, as expected.
Looking ahead, the absence of high-profile scheduled event risk leaves the markets somewhat rudderless and may yield quiet, consolidative price action in the hours ahead. The lull may open the door for unusually high headline sensitivity however, which may amplify the threat of seesaw volatility in the near term.
Are gold and oil prices matching DailyFX analysts’ forecasts? Find out here !
GOLD TECHNICAL ANALYSIS – Gold prices continue to tread water at rising trend line support set from late May. A break below this barrier – now at 1337.85 – targets the 38.2% Fibonacci retracement at 1308.00. Alternatively, a break above the 1366.19-77.75 area (double top, 38.2% Fib expansion) exposes the 50%level at 1398.46.
CRUDE OIL TECHNICAL ANALYSIS – Crude oil prices look vulnerable to deeper losses after producing the largest decline in a week. A daily close below the 23.6% Fibonacci expansion at 40.55 targets the August 3 low at 39.17, followed by the 38.2% level at 38.73. Alternatively, a reversal back above the 14.6% Fib at 41.67 paves the way for a retest of the August 9 high at 43.49, a barrier reinforced by the 38.2% Fib retracement at 43.94.

--- Written by Ilya Spivak, Currency Strategist for DailyFX.com
To receive Ilya's analysis directly via email, please SIGN UP HERE
Contact and follow Ilya on Twitter: @IlyaSpivak


