


What's inside:
- S&P 500 and Dow Touch off Key Trend-lines
- Pullback due, but very strong advances don't usually reverse without a fight first
- Watching hourly charts for possible short entries
Yesterday was looking like the Dow was on its way to doing what it has only done eleven other times in the last 25 years; close higher for an eighth consecutive day. But that was not to be as the market entered into ‘power hour’ (last hour of cash trading). The Dow touched off the trend-line we have been discussing which runs back to the May 2015 record high over late-year tops. A breakout through doesn't leave it much room for further gains before running into a signficant resistance zone between 17750 and 18000.
Dow Daily: Sep '15 - Present

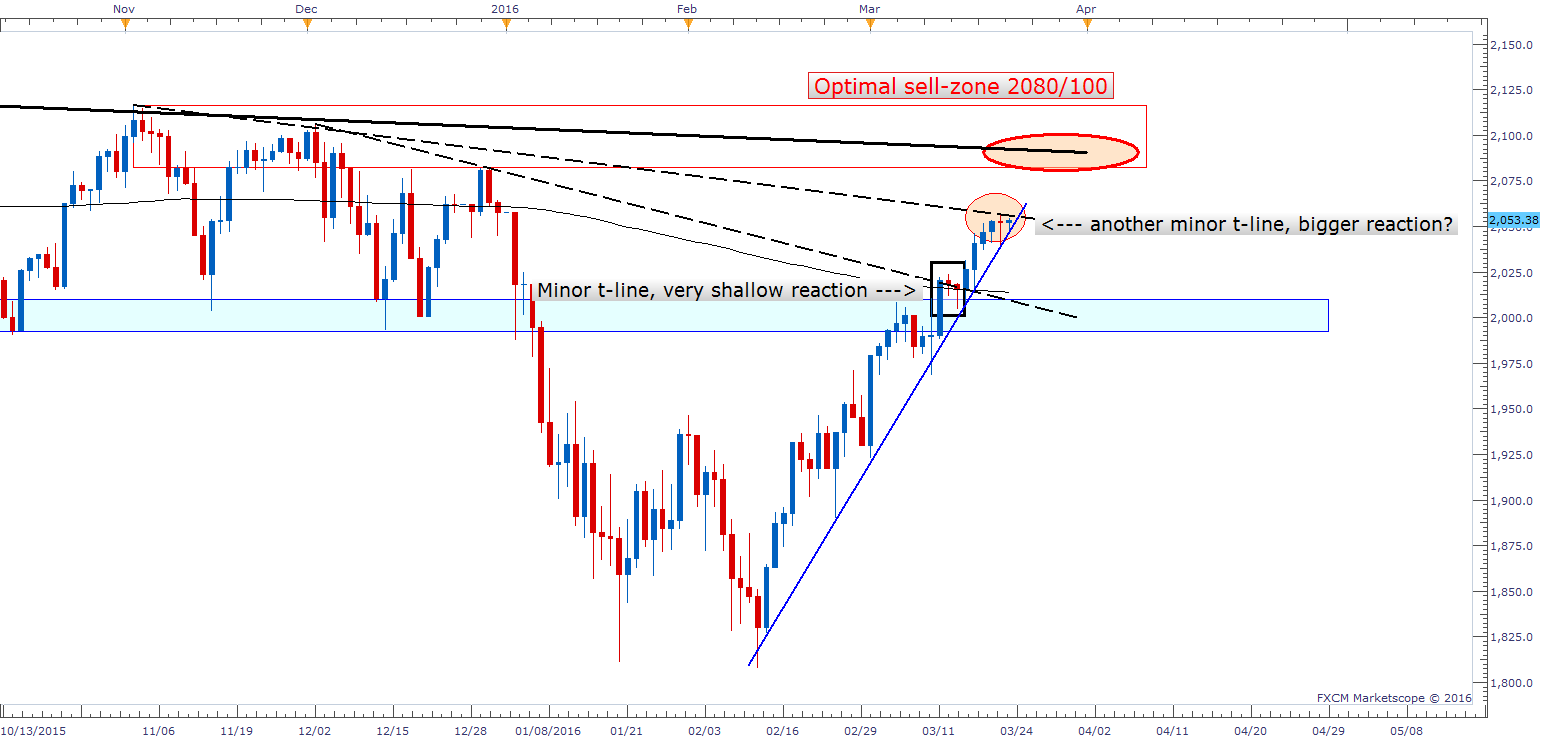
The S&P 500 attempted to trade above a trend-line of lesser degree extending back to a pair of peaks created in November/December, but sellers were there as well (for now). The last trend-line of minor importance about 30 handles lower kept the S&P suppressed for only a couple of days. So, how it reacts off the one before us should help give a tell as to whether to expect the market to treat as it did from the last minor trend-line (quick/shallow pullback, break higher), or whether it will hold greater significance (beginning of a meaningful pullback/decline). Like the Dow, a breakout above t-line resistance will soon find the index at a much more meaningful wall of resistance.
S&P 500 Daily: Oct '15 - Present
While the market is due for a pullback, it doesn’t usually fall out of the sky after exhibiting so much persistent momentum. Even if we are very near a sizable turning point, stubborn buyers are likely to continue to step in until they run out of ammunition. This can take a few days, a week, or longer before seeing the market roll over and embark on a material decline. Knowing this keeps our excitement from the short-side tempered at this time. But...
Getting more granular: If we see a series of lower highs, lower lows develop on the hourly chart or some other technical development such as a 'head-and-shoulders' formation we may find ourselves with a good risk/reward entry point for initiating a short position. We have been in the ‘buy-the-dip’ (BTD) camp for a while now, but at this juncture that has become an increasingly dangerous and more difficult proposition.
Markets in the US are closed on Friday and also on Monday in Europe for Easter holiday, so today could be the last ‘real’ day of trading as market participants begin to head for the exits early for a long weekend. On that, we will keep it light until next week where we should gain better clarity about what our next moves should be.
Find out what profitable traders are doing, learn to put the edge in your favor.
---Written by Paul Robinson, Market Analyst
You can follow Paul on Twitter @PaulRobinsonFX, or email him directly at instructor@dailyfx.com.


