


Talking Points:
- US Dollar Continues to Digest at Monthly Swing Low
- S&P 500 Stalls at Chart Support After Expected Drop
- Crude Oil Trying to Expose $60, Gold Clears $1200/oz
Can’t access the Dow Jones FXCM US Dollar Index? Try the USD basket on Mirror Trader. **
US DOLLAR TECHNICAL ANALYSIS – Prices reversed downward as expected, making good on bearish cues telegraphed through negative RSI divergence. Near-term support is in the 11854-78 area (March 2009 high, 14.6% Fibonacci expansion), with a break below that on a daily closing basis exposing the 11679-737 region (February 26 low, 38.2% Fib retracement). Alternatively, a move back above the 23.6% level at 11965 clears the way for a test of the 12107-49 zone (38.2% expansion, March 13 high).
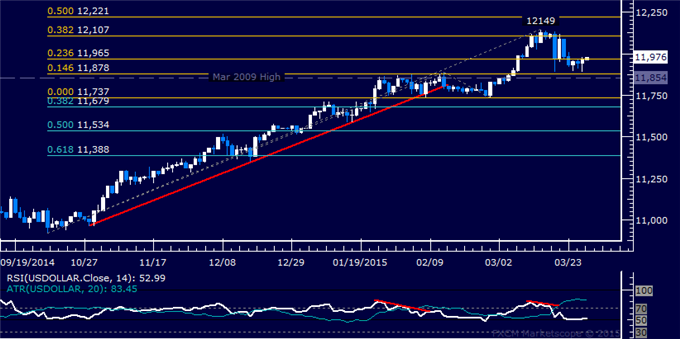
Daily Chart - Created Using FXCM Marketscope
** The Dow Jones FXCM US Dollar Index and the Mirror Trader USD basket are not the same product.
S&P 500 TECHNICAL ANALYSIS – Prices declined as expected after putting in a bearish Evening Star candlestick pattern below February’s swing high. A daily close belowchannel floor support at 2058.50 exposes the March 12 low at 2040.10. Alternatively, a reversal above the 14.6% Fibonacci expansion at 2084.00 targets the 2111.00-19.40 area (23.6% level, February 25 high).
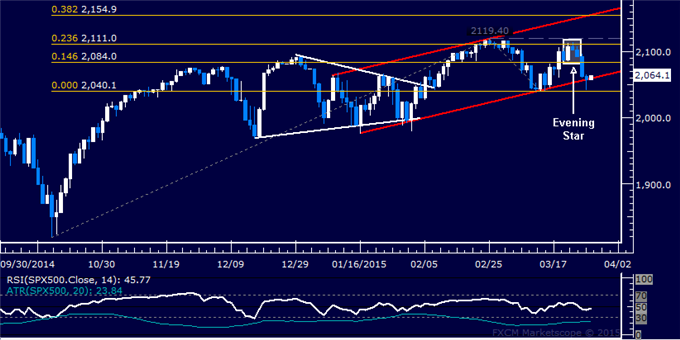
Daily Chart - Created Using FXCM Marketscope
GOLD TECHNICAL ANALYSIS – Prices secured a foothold above the $1200/oz figure as expected. A daily close above the 38.2% Fibonacci retracement at 1205.58 exposes the 50% level at 1225.04. Alternatively, a turn below the 23.6% Fib at 1181.51 targets the 14.6% retracement at 1166.67.
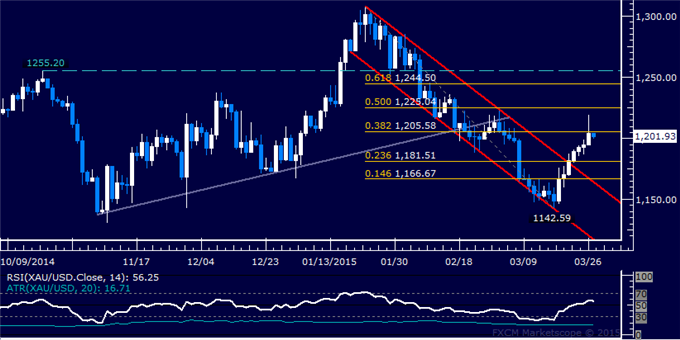
Daily Chart - Created Using FXCM Marketscope
CRUDE OIL TECHNICAL ANALYSIS – Prices launched sharply higher, with buyers attempting to clear a path above the $60/barrel figure. A daily close above the 38.2% Fibonacci expansion at 59.35 exposes the 50% level at 61.45. Alternatively a reversal below a horizontal pivot at 58.17 targets the 23.6% Fib at 56.75.
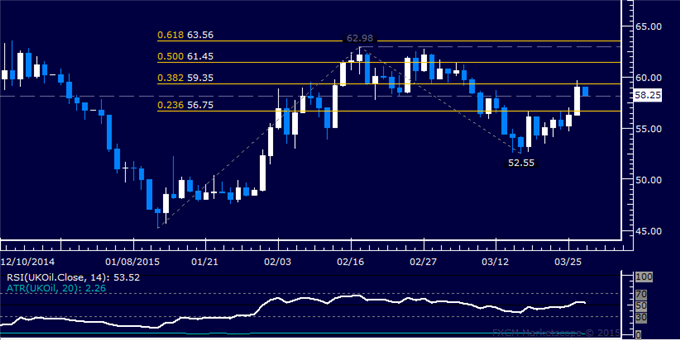
Daily Chart - Created Using FXCM Marketscope
--- Written by Ilya Spivak, Currency Strategist for DailyFX.com
To receive Ilya's analysis directly via email, please SIGN UP HERE
Contact and follow Ilya on Twitter: @IlyaSpivak


