


Talking Points:
- US Dollar Continues to Seesaw in a Choppy Range
- S&P 500 Aiming to Challenge Record High Again
- Gold Breaks Channel Top, Crude Oil Consolidating
Can’t access the Dow Jones FXCM US Dollar Index? Try the USD basket on Mirror Trader. **
US DOLLAR TECHNICAL ANALYSIS – Prices reversed downward as expected, making good on bearish cues telegraphed through negative RSI divergence. Near-term support is at 11965, the 23.6% Fibonacci expansion, with a break below that on a daily closing basis exposing the 11854-78 area (March 2009 high, 14.6% level). Alternatively, a move above the 12107-49 zone (38.2% Fib, March 13 high) clears the way for a test of the 50% expansion at 12221.
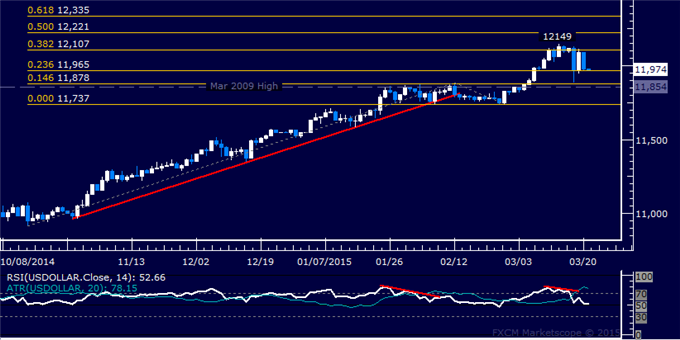
Daily Chart - Created Using FXCM Marketscope
** The Dow Jones FXCM US Dollar Index and the Mirror Trader USD basket are not the same product.
S&P 500 TECHNICAL ANALYSIS – Prices have returned to challenge record highs. A daily close above the 2111.00-19.40 area (23.6% Fibonacci expansion, February 25 high) exposes the 38.2% level at 2154.90. Alternatively, a reversal below the 14.6% Fib at 2084.00 targets rising trend line support at 2052.90.
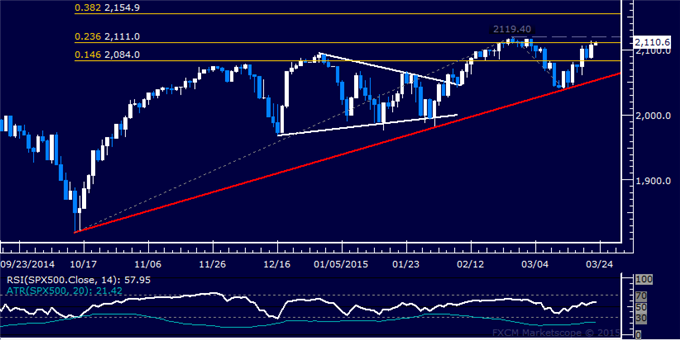
Daily Chart - Created Using FXCM Marketscope
GOLD TECHNICAL ANALYSIS – Prices look poised for another move above the $1200/oz figure. A break above the 38.2% Fibonacci retracement at 1205.58 exposes the 50% level at 1225.04. Alternatively, a turn below channel top resistance-turned-support at 1176.27 targets the 14.6% Fib at 1166.67.
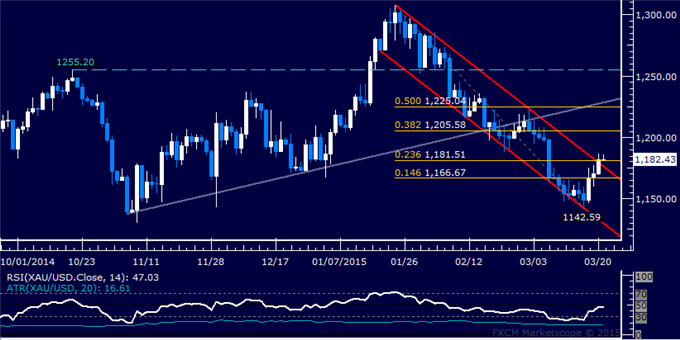
Daily Chart - Created Using FXCM Marketscope
CRUDE OIL TECHNICAL ANALYSIS – Prices continue to digest below three-week-old trend line resistrance. A break below the 50% Fibonacci retracement at 54.08 exposes the 51.97-52.55 area (March 17 low, 61.8% level). Alternatively, a push above the 23.6% Fib expansion at 56.75 targets support-turned-resistance at 58.17.
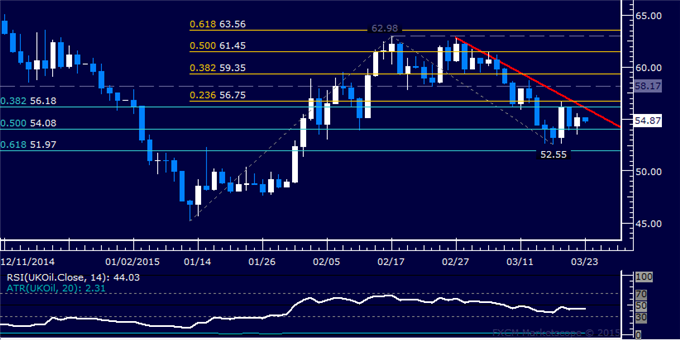
Daily Chart - Created Using FXCM Marketscope
--- Written by Ilya Spivak, Currency Strategist for DailyFX.com
To receive Ilya's analysis directly via email, please SIGN UP HERE
Contact and follow Ilya on Twitter: @IlyaSpivak


