


Nasdaq (US Tech 100) Outlook:
- US tech stocks remain resilient ahead of Jackson Hole
- Nasdaq 100 eyes resistance at the key psychological level of 13,000
- USD strength returns to markets limiting equity moves

Nasdaq 100 (US Tech) Analysis
US tech heavy Nasdaq 100 (NDX) is showing limited movement despite the explicit fundamentals that remain on the radar. In anticipation of the annual Jackson hole economic symposium, volatility and liquidity has remained relatively light with the resumption of USD strength limiting the upside move.

After rising to a high of 16,767.50 in November last year, price action has experienced large swings that dragged the index to the 11,000-psych level that held out in 2020.
The analysis contained in article relies on price action and chart formations. To learn more about price action or chart patterns, check out our DailyFX Education section.
A bounce off support at 11,068 in June allowed US tech stocks to rebound until stagnating around the January low at 13,707. On the monthly timeframe, a potential hammer formation has lead to an increase in bearish traction with buyers forming an additional layer of resistance at the 13,600 psychological level. With a crossover of the MACD (moving average convergence/divergence) above the zero-line, technical levels may pose an additional hurdle for bulls trading tech stocks.
Nasdaq (US Tech 100) Futures Monthly Chart
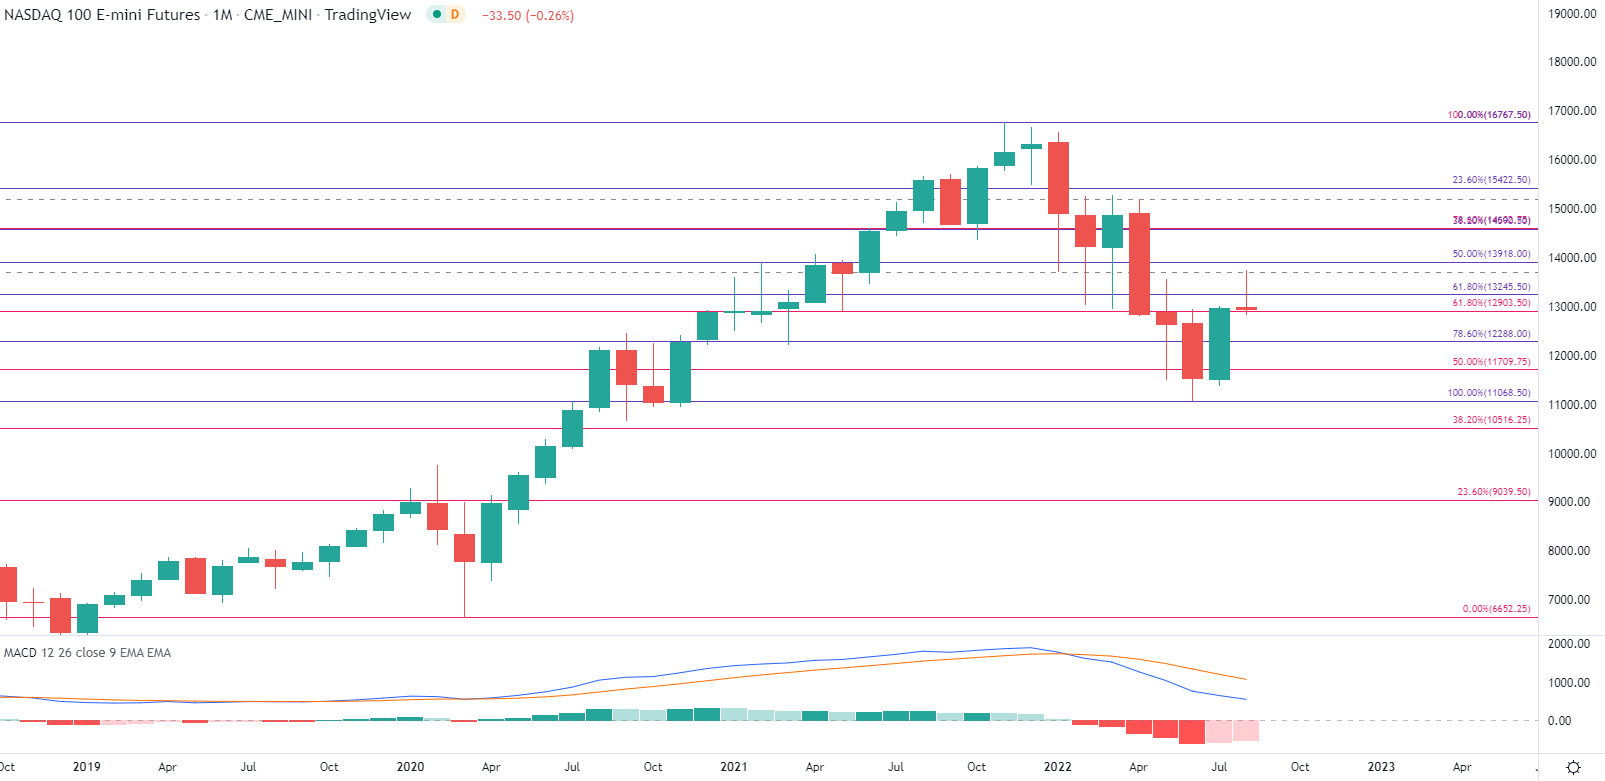
Chart prepared by Tammy Da Costa using TradingView
With equities currently trading with lackluster motion, the daily chart highlights the manner in which price action has remained in a fragile range. With interest rates at the forefront of sentiment, another hawkish tilt or lack of may allow Nasdaq to find a fresh bout of momentum .
With prices falling to the 61.8% retracement of the 2020 – 2021 move holds as support at 12,903 with the next level of support holding at 12,288.
Nasdaq Futures Daily Chart
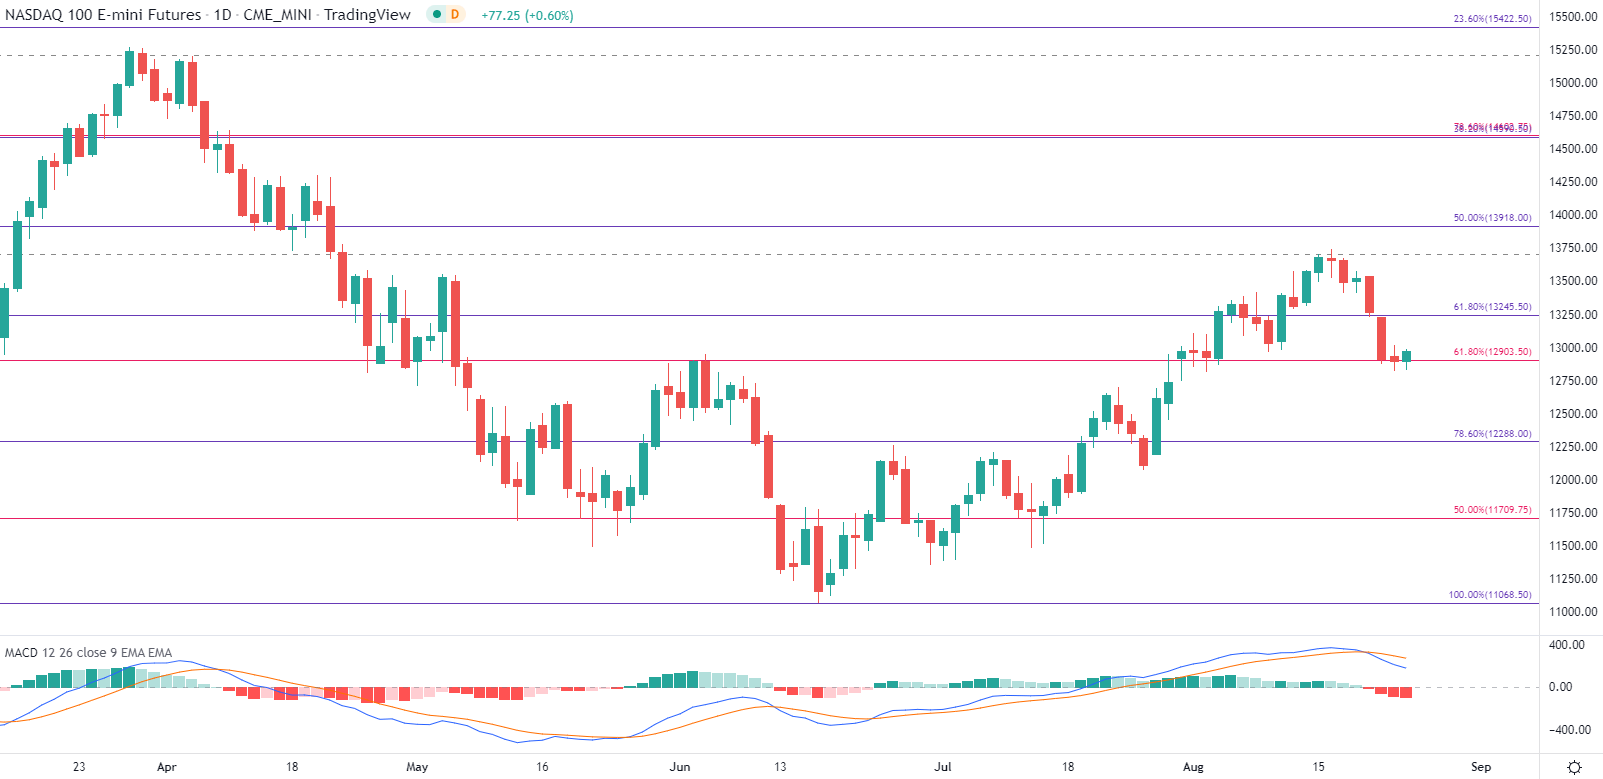
Chart prepared by Tammy Da Costa using TradingView
Although US equities have remained resilient amid the current fundamental backdrop, the downward move has been muted by that 12,900 handle that remains as critical support. If bears manage to break through this level, the next zone of support will likely hold at 12,400 which capped the upside move in July.
NASDAQ (US Tech) Four-hour Chart
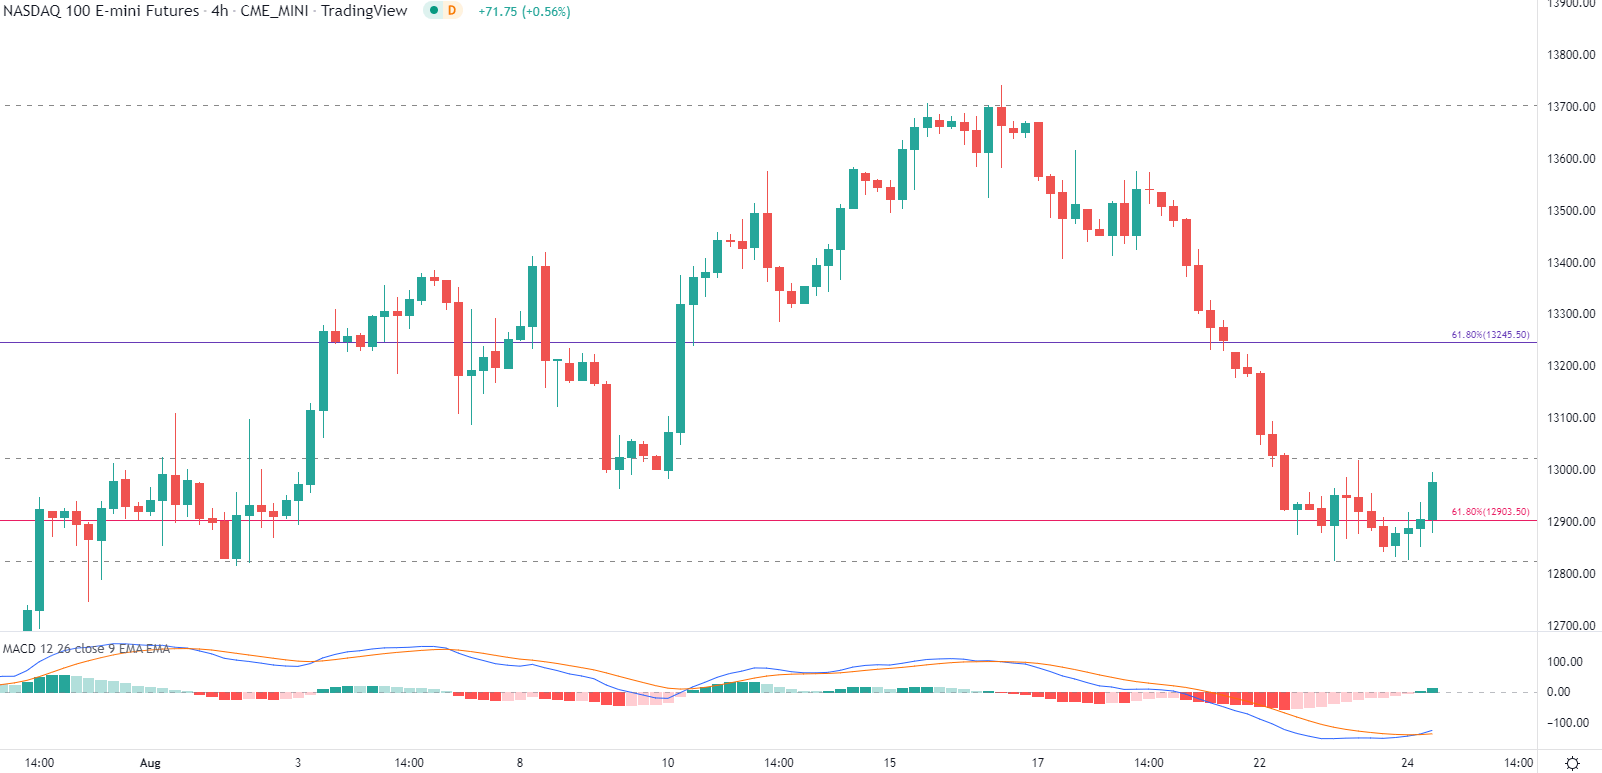
Chart prepared by Tammy Da Costa using TradingView
For the upside move, a break of 13,000 may offer bulls a retest of 13,200 as bulls aim to retest the August 2022 high at 13,740.
--- Written by Tammy Da Costa, Analyst for DailyFX.com
Contact and follow Tammy on Twitter: @Tams707


