


DJIA, DAX, FTSE Overview:
- Wall Street 30 (DJI) downward move capped by psychological support
- German Dax 40 indecisive after suffering hefty losses
- FTSE 100 sellers increase pressure as bears remain committed to drive price action lower
Equity Wrap – Dow, Dax, Ftse Price Action
It’s been a tough year for risk assets and for global economic growth. For major stock indices and cryptocurrency, interest rates and elevated price pressures are an apparent catalyst for price action with technical levels supporting short and longer-term moves.
Visit the DailyFX Educational Center to discover the impact of politics on global markets
With Dow Jones reaching an all-time high of 36,971 in January, the German Dax 40 peaked in November last year at a record level of 16,295. Meanwhile, the FTSE 100 attempted to retest the Jan 2020 pre-pandemic high of 7,689.67 in February but fell short after being rejected by the 7,687.27 mark.
DJI (Wall Street 30) Technical Analysis
A softer US Dollar has limited the downside move with the 78.6% Fibonacci retracement level of the 2020 – 2022 move holding as support at 32,956. After rising slightly above the May high of 34,134, a bounce off 34,295 sent the Dow lower as the 200-day MA (moving average) formed an additional layer of resistance at 33,760.
With this level currently intact, a MACD (moving average convergence/divergence) crossover above the zero line may be indicative of a slowdown in bullish momentum while the 50-day MA provides support at 31,293.
DJI Daily Chart
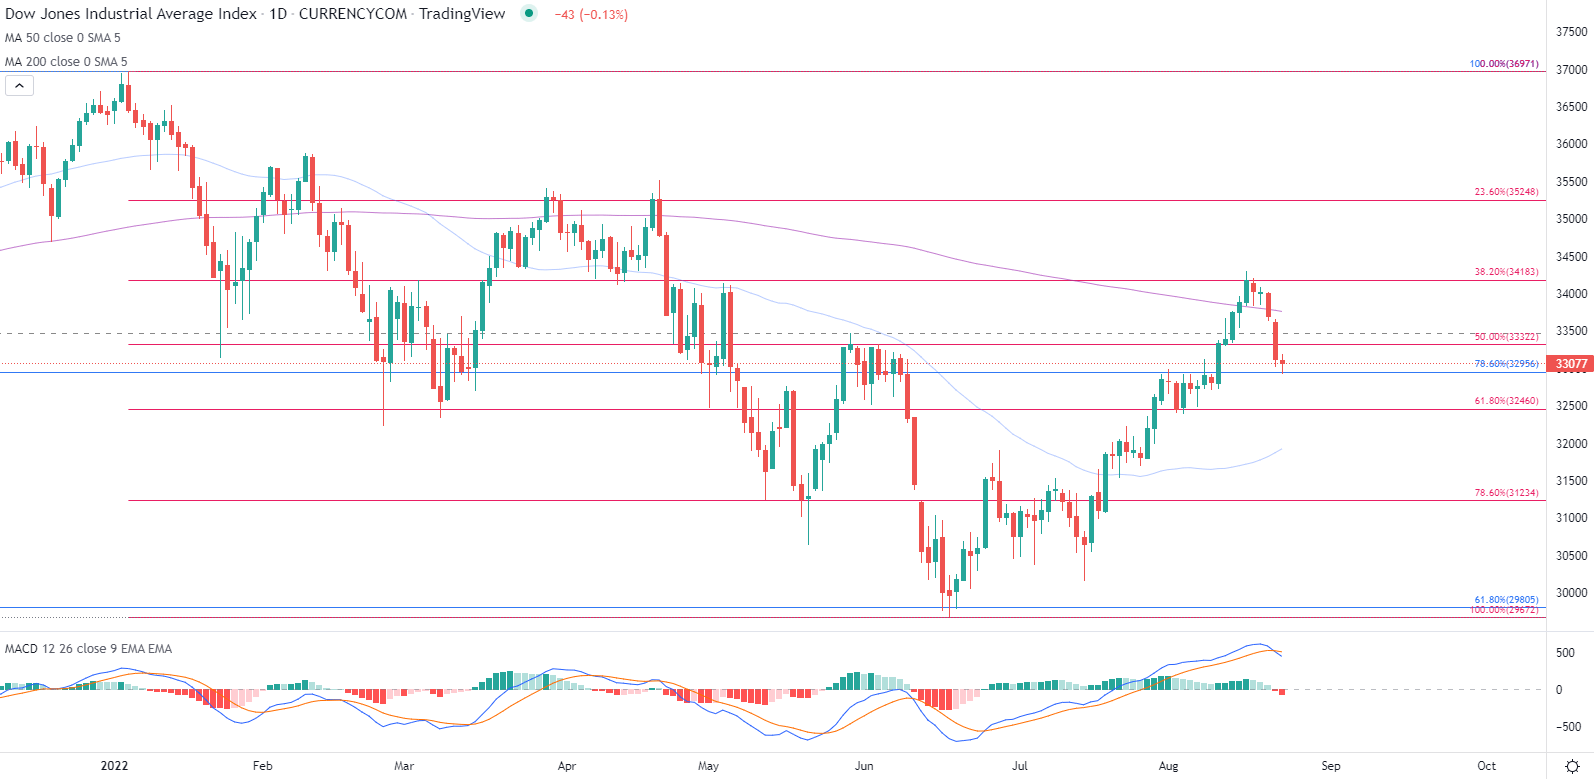
Chart prepared by Tammy Da Costa using TradingView
Dow Jones Key Levels
| Support | Resistance |
|---|---|
| S1: 32,956 (78.6% retracement of the 2020 – 2022 move) | R1: 33,322 (50% retracement of the 2022 move) |
| S2: 32,460 (61.8% Fib of the 2022 move) | R2: 33, 760 (50-day MA) |
| S3: 31, 922 (200-day MA) | R3: 34,295 (Monthly high) |
Germany 40 (DAX) Technical Analysis
After falling short of the November high in Jan, a rebound off 16,274 humbled the Dax which has been on a downward trajectory ever since. For Europe’s largest economy, Germany has suffered a major setback since the invasion of Ukraine that has weighed heavily on the performance-based index.

A brutal start of the week saw German stocks sink lower before finding support at 13, 161 (the 23.6% retracement of the Feb – July move). On the daily chart below, the 76.4% retracement of the 2003- 2021 move is currently providing resistance at 13,296 while the MACD follows the Dow’s footsteps by crossing above the zero-line.
DAX Futures Daily Chart
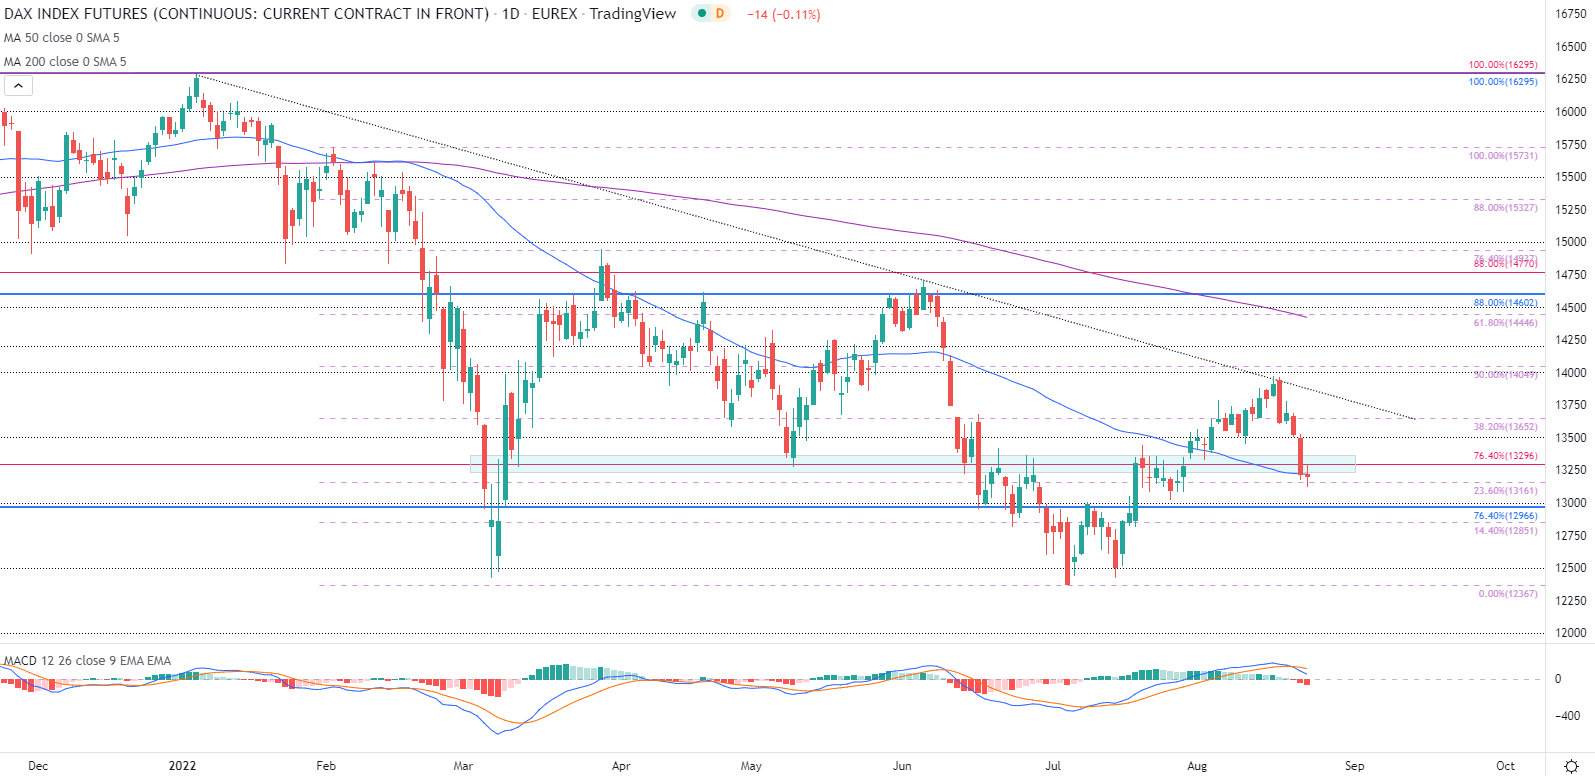
Chart prepared by Tammy Da Costa using TradingView
DAX 40 Levels
| Support | Resistance |
|---|---|
| S1: 13,161 (23.6% retracement of the Feb - July move) | R1: 13,296 (76.4% retracement of the 2003 – 2021 move) |
| S2: 13, 000 (psych level) | R2: 13, 400 (psych level) |
| S3: 12, 851 (14,4% Fib of the Feb – July move) | R3: 13,652 (38.2% Fib of the Feb – July move) |
FTSE 100 Analysis
| Change in | Longs | Shorts | OI |
| Daily | -30% | 25% | 2% |
| Weekly | -44% | 44% | 0% |
At the time of writing, FTSE 100: Retail trader data shows 21.76% of traders are net-long with the ratio of traders short to long at 3.60 to 1. The number of traders net-long is 4.15% higher than yesterday and 4.53% higher from last week, while the number of traders net-short is 1.29% higher than yesterday and 3.96% higher from last week.
We typically take a contrarian view to crowd sentiment, and the fact traders are net-short suggests FTSE 100 prices may continue to rise.
Yet traders are less net-short than yesterday and compared with last week. Recent changes in sentiment warn that the current FTSE 100 price trend may soon reverse lower despite the fact traders remain net-short.
--- Written by Tammy Da Costa, Analyst for DailyFX.com
Contact and follow Tammy on Twitter: @Tams707


