


Gold Price (XAU/USD), Chart, and Analysis
- US dollar moving higher as risk markets take a turn lower.
- Gold eyes $1,700/oz. or lower on renewed rate fears.

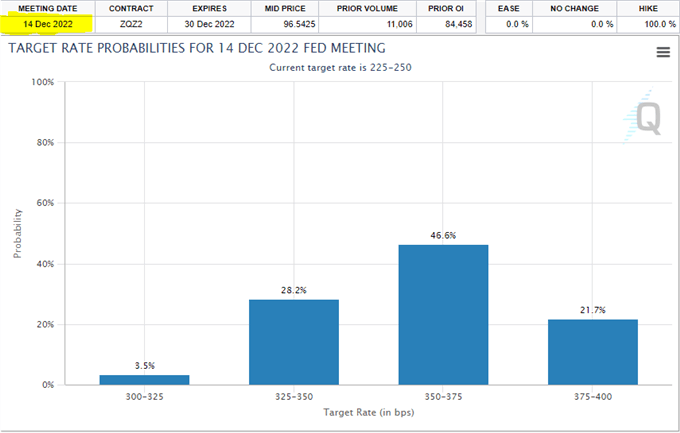
The US Fed Funds rate is seen 125 basis points higher than its current level by the end of the year as market expectations see the Federal Reserve continuing to hike rates in the war against inflation. The Fed Funds rate currently stands at 2.25% to 2.50%. and is seen hitting 3.50% to 3.75% by mid-December.
The renewed push higher in both US rate expectations and the US dollar is being driven by thoughts that the US Federal Reserve chair will double down on his hawkish outlook when he speaks at the Jackson Hole Economic Symposium on Friday (14:00GMT). Recent thoughts that the Fed may make a dovish pivot as recession fears grow were put to bed last week after a raft of Fed members spoke backing further, aggressive, rate hikes in the coming months.
This week also sees the latest (2nd) look at US Q2 GDP on Thursday – expected -0.8% - and the Fed’s favorite inflation measure, Core PCE on Friday. With the latest inflation figure being released just 90 minutes before Jerome Powell speaks, beware of heightened volatility going into the weekend.
Trade Smarter - Sign up for the DailyFX Newsletter
Receive timely and compelling market commentary from the DailyFX team
For all market-moving data releases and events, see the DailyFX Economic Calendar.
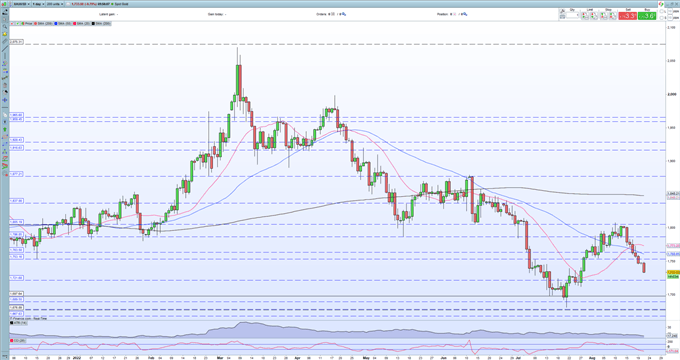
The daily gold chart is rolling over with little in the way of support before $1,700/oz. comes into view. Minor support at $1,721/oz. (September 2021 double-low) may slow gold’s trajectory lower, as may the CCI indicator which sits in oversold territory.
Gold Daily Price Chart – August 22, 2022
Retail trader data show 79.12% of traders are net-long with the ratio of traders long to short at 3.79 to 1. The number of traders net-long is 0.49% higher than yesterday and 7.47% higher from last week, while the number of traders net-short is 3.81% higher than yesterday and 10.44% lower from last week.
We typically take a contrarian view to crowd sentiment, and the fact traders are net-long suggests Gold prices may continue to fall. Positioning is less net-long than yesterday but more net-long from last week. The combination of current sentiment and recent changes gives us a further mixed Gold trading bias.
| Change in | Longs | Shorts | OI |
| Daily | 1% | -3% | -1% |
| Weekly | 2% | -8% | -2% |
What is your view on Gold – bullish or bearish?? You can let us know via the form at the end of this piece or you can contact the author via Twitter @nickcawley1.


