


Silver (XAG/USD) Talking Points
- XAG/USD limited by technical resistance
- Psychological support holds firm with candlestick patterns highlighting key pivot points
- USD strength prevails, limiting commodity gains

Silver Technical Analysis
Silver futures are trading at a critical juncture as the industrial metal lingers below 21.00. After rebounding off the 18.00 psychological level in mid-July, prices managed to push higher before facing the next big zone of resistance at 20.00.
On the monthly timeframe, the formation of a dragonfly doji was later accompanied by a bearish engulfing on the weekly chart driving the CCI into oversold territory. In technical analysis, the above-mentioned candlestick patterns are often indicative of a potential reversal that generally occurs after steep decline.
What is Silver? Understanding Silver as a Trader’s Commodity
Silver (XAG/USD) Monthly Chart
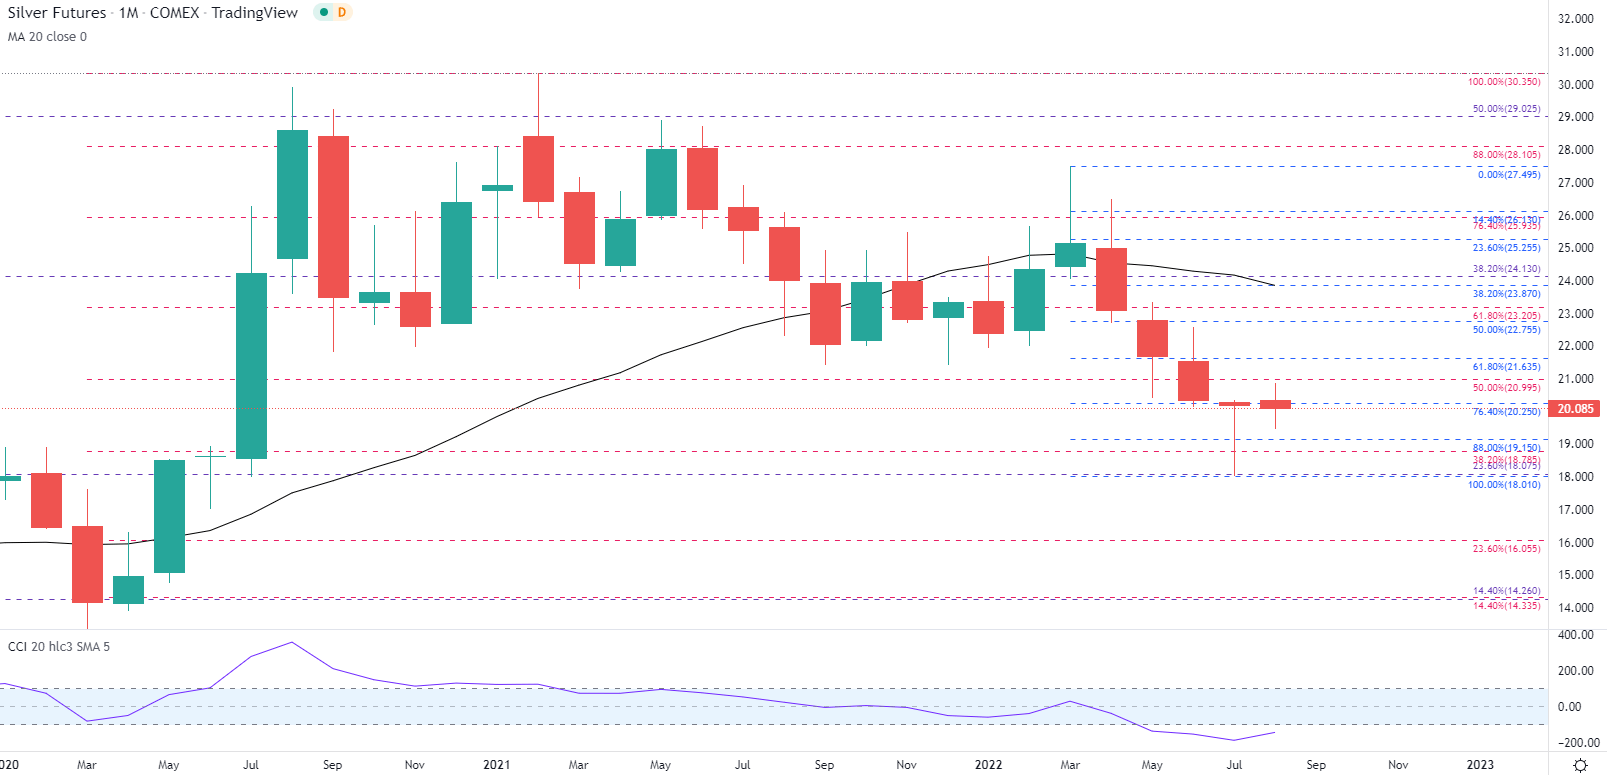
Chart prepared by Tammy Da Costa using TradingView

Although aggressive rate hikes and a hawkish Federal Reserve have limited the upside move, USD strength has posed an additional threat for price action. With the greenback’s the reserve currency status enhancing its safe-haven appeal, silver bulls aren’t backing off anytime soon, bringing technical levels of support and resistance back into play.
From a daily standpoint, a rejection of the 78.6% retracement of the March to June move allowed bulls to find a comfortable level of support above the 20.00 mark. With the 20-day MA (moving average) providing an additional layer of support at 19.758, a break of 21.00 could draw focus back towards prior support turned resistance at 21.635.
Silver (XAG/USD) Daily Chart
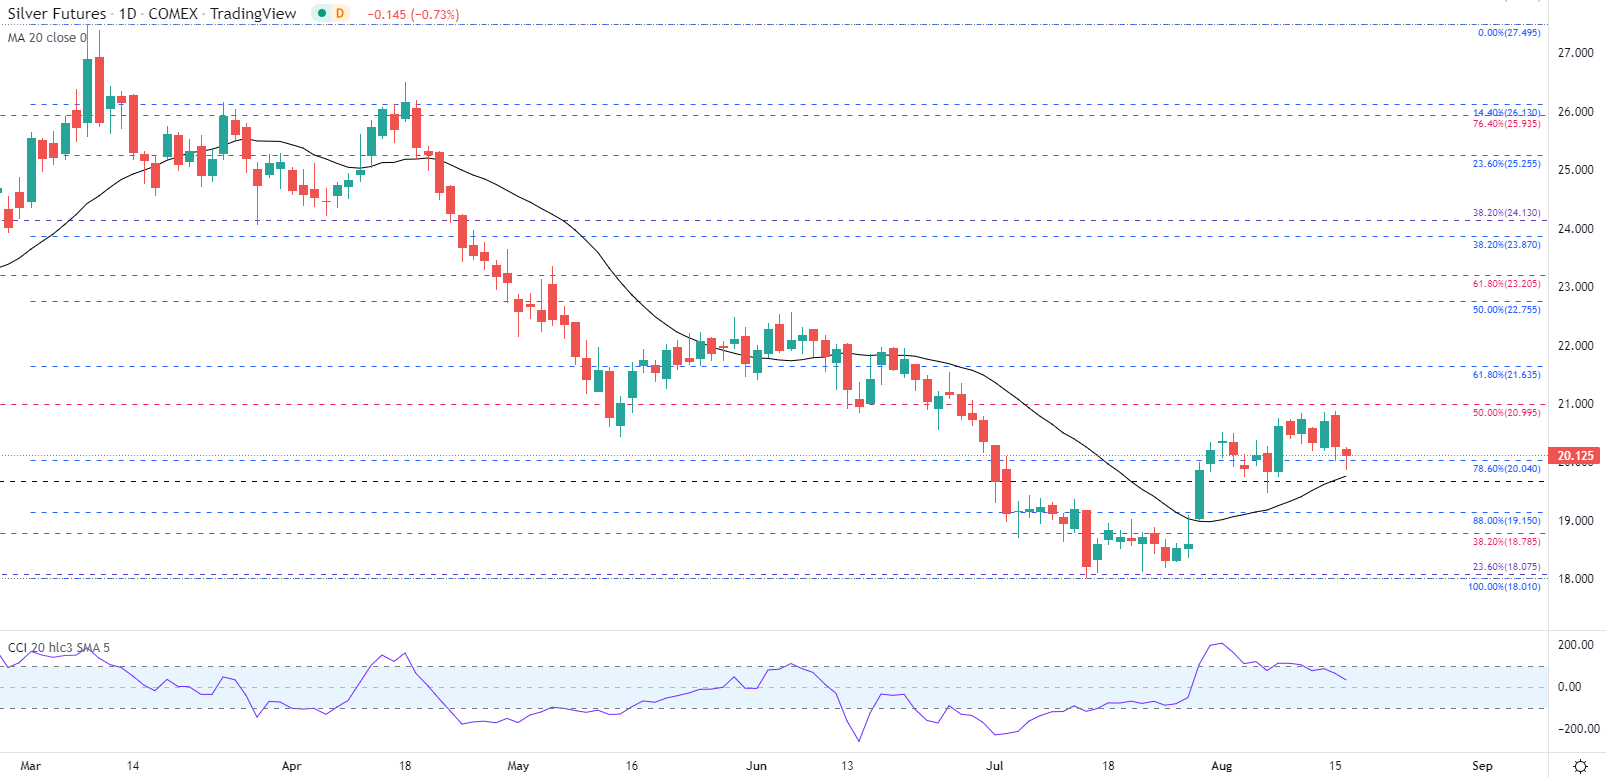
Chart prepared by Tammy Da Costa using TradingView
Silver Sentiment
| Change in | Longs | Shorts | OI |
| Daily | 3% | 2% | 3% |
| Weekly | 4% | -9% | 2% |
At the time of writing, Retail trader data shows 88.53% of traders are net-long with the ratio of traders long to short at 7.72 to 1. The number of traders net-long is 0.16% lower than yesterday and 2.36% lower from last week, while the number of traders net-short is 42.77% higher than yesterday and 21.67% higher from last week.
We typically take a contrarian view to crowd sentiment, and the fact traders are net-long suggests Silver prices may continue to fall.
Yet traders are less net-long than yesterday and compared with last week. Recent changes in sentiment warn that the current Silver price trend may soon reverse higher despite the fact traders remain net-long.
--- Written by Tammy Da Costa, Analyst for DailyFX.com
Contact and follow Tammy on Twitter: @Tams707


