


FTSE Talking points:
- FTSE 100 rally runs out of steam after falling from key psychological resistance
- UK stocks take strain with a 4.6% decline in health stocks restricting further gains
- GBP under pressure with recession fears weighing on the Pound

FTSE 100 Technical Analysis
The FTSE 100 relief rally has been muted after briefly testing psychological resistance at 7,500. After rebounding off another big zone of support in mid-July, prices have been rising steadily despite a few short-bodied candles and extended wicks indicative of indecision.
Visit DailyFX Education to Learn More About the Power of the Wick
With Fibonacci levels from the June move providing support and resistance at 7,398 (38.2% retracement) and 7,553, price action currently remains above the 10-day MA (moving average) which continues to provide an additional layer of support at 7,452.

However, while bulls aim to recover from the June slump, the CCI (commodity channel index) has temporarily fallen from overbought territory with divergence suggesting that the uptrend may be running out of steam.
FTSE 100 Daily Chart
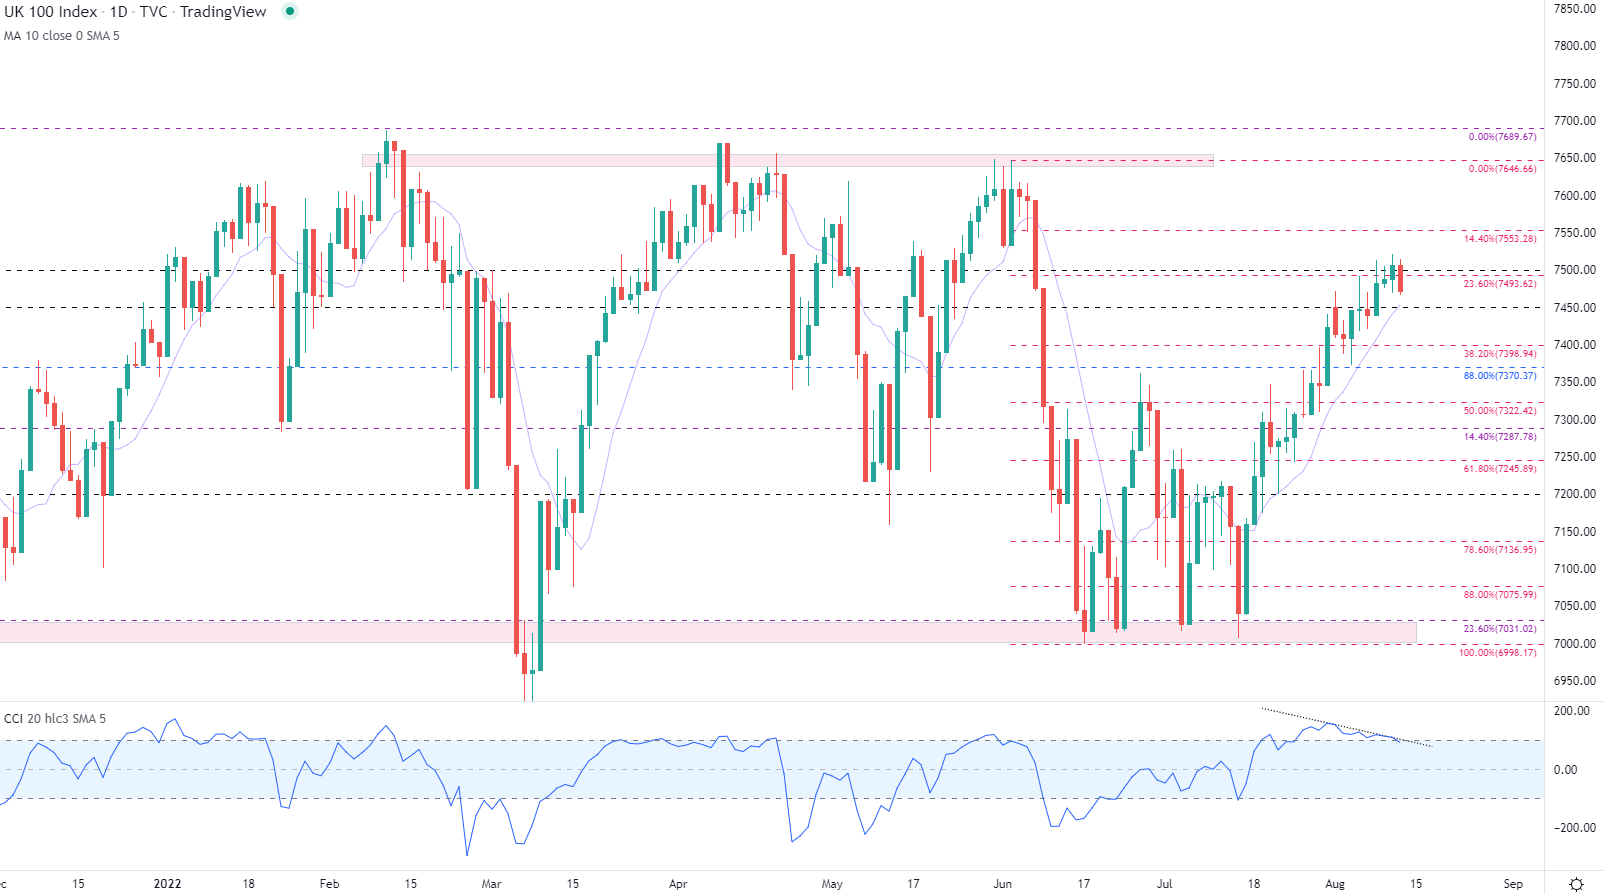
Chart prepared by Tammy Da Costa using TradingView
On the four-hour chart below, failure to gain traction above 7,520 resulted in the formation of a doji candle, allowing bears to drive prices back below the 10-period MA. With a narrow zone of confluency forming between 7,450 and 7,500, a break of the narrow range may provide an additional catalyst for price action.

FTSE 100 Four-Hour Chart

Chart prepared by Tammy Da Costa using TradingView
UK 100 Biggest Movers
As UK stocks prepare for the European close, energy stocks have led gains, advancing by approximately 1.65% while the health care sector drags the index down with a loss of around 4.63%.
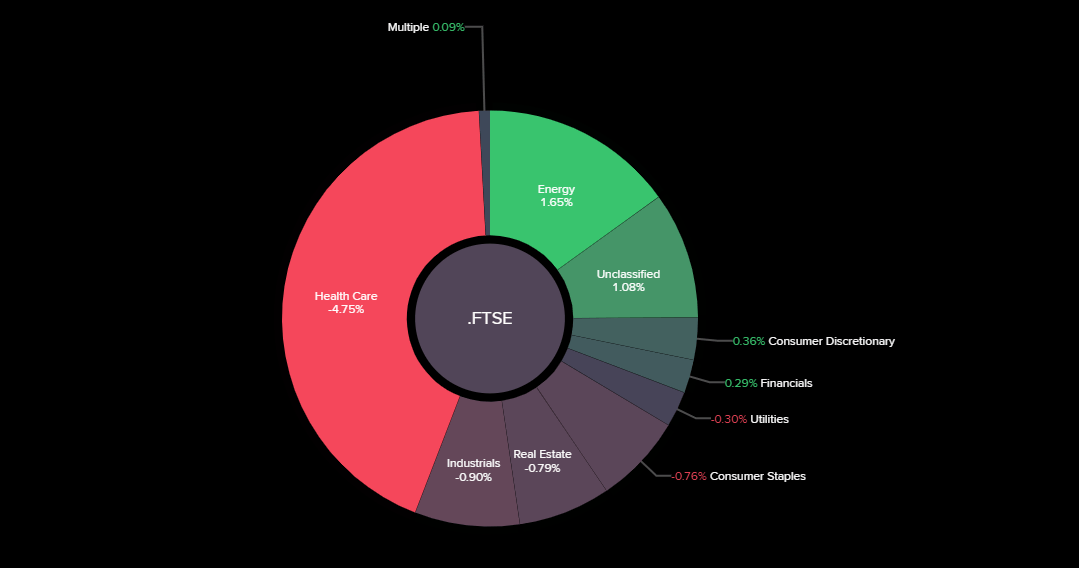
Source: Refinitiv
FTSE 100 Sentiment
| Change in | Longs | Shorts | OI |
| Daily | -30% | 25% | 2% |
| Weekly | -44% | 44% | 0% |
FTSE 100: Retail trader data shows 28.39% of traders are net-long with the ratio of traders short to long at 2.52 to 1. The number of traders net-long is 11.24% higher than yesterday and 4.64% lower from last week, while the number of traders net-short is 6.57% lower than yesterday and 12.84% higher from last week.
We typically take a contrarian view to crowd sentiment, and the fact traders are net-short suggests FTSE 100 prices may continue to rise.
Positioning is less net-short than yesterday but more net-short from last week. The combination of current sentiment and recent changes gives us a further mixed FTSE 100 trading bias.
FTSE 100 Key Levels
| Support | Resistance |
|---|---|
| S1: 7,450 | R1: 7,500 |
| S2: 7,370 | R2: 7,553 |
| S3: 7,287 | R3: 7,609 |
--- Written by Tammy Da Costa, Analyst for DailyFX.com
Contact and follow Tammy on Twitter: @Tams707


