


Gold Price (XAU/USD), Chart, and Analysis
- Prior support levels now turn into resistance levels.
- US House Speaker Nancy Pelosi to visit Taiwan.
- Retail traders trim their overall long positions

For all market-moving data releases and events, see the DailyFX Economic Calendar.
The US House of Representatives Speaker Nancy Pelosi is said to be visiting Taiwan today, sparking anger and fears of retaliation from Beijing. Ms. Pelosi is said to be leading a delegation visiting various countries in the Asian region, including Singapore, Japan, and South Korea, with Taiwan not on the official list. In response to stories of Ms. Pelosi’s visit, a Chinese Foreign Ministry spokesperson warned of the ‘serious consequences’ of any visit, adding ominously that China ‘are fully prepared for any eventuality’. If Ms. Pelosi visits Taiwan and China retaliates, as it has openly said that it would, then risk-off assets including gold will receive a strong haven bid. Taiwan, officially the Republic of China, is an island of just over 23.5 million people off the East coast of China.
Trade Smarter - Sign up for the DailyFX Newsletter
Receive timely and compelling market commentary from the DailyFX team
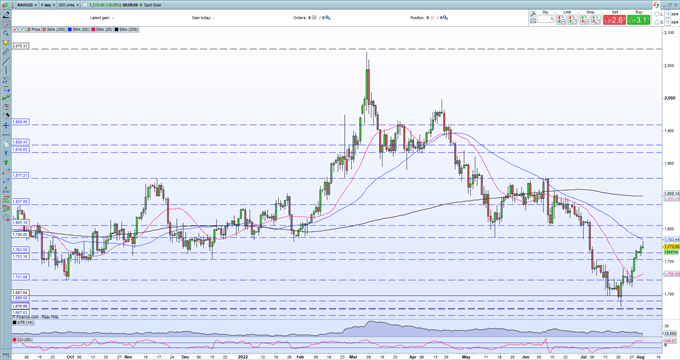
Gold has moved sharply higher since hitting a fresh one-year low of $1,680/oz. on July 21. The rally has produced a near-unbroken series of higher highs and higher lows and has taken out the 20-day simple moving average in the process. The precious metal is now running into a zone of prior support turned resistance on either side of $1,787/oz, while the 50-day sma is a touch lower at $1,783.5/oz. For gold to overcome this area of resistance, it will require a notable driver of risk.
The retail trader gold data, shown below, shows how traders have trimmed their overall long positions over the last week, with net-longs nearly 15% lower while net-shorts grew by nearly 30%.
Gold Daily Price Chart – August 2, 2022
Retail trader data show84.40% of traders are net-long with the ratio of traders long to short at 5.41 to 1. The number of traders net-long is 0.11% higher than yesterday and 15.11% lower from last week, while the number of traders net-short is 4.85% higher than yesterday and 29.88% higher from last week.
We typically take a contrarian view to crowd sentiment, and the fact traders are net-long suggests Gold prices may continue to fall. Yet traders are less net-long than yesterday and compared with last week. Recent changes in sentiment warn that the current Gold price trend may soon reverse higher despite the fact traders remain net-long.
| Change in | Longs | Shorts | OI |
| Daily | 1% | -3% | -1% |
| Weekly | 2% | -8% | -2% |
What is your view on Gold – bullish or bearish?? You can let us know via the form at the end of this piece or you can contact the author via Twitter @nickcawley1.


