


Gold Price (XAU/USD), Chart, and Analysis
- Gold needs a driver to break the current lethargy.
- Retail traders remain heavily net-long of gold.

For all market-moving data releases and events, see the DailyFX Economic Calendar.
A lack of any fresh drivers is taking its toll on gold this week with the precious metal stuck in a short-term range with little reason to look for a breakout. The FOMC meeting next week means that a Fed-speak blackout is in place and with no real big economic releases in the US, markets are starting to tread water ahead of next week’s decision.
Trade Smarter - Sign up for the DailyFX Newsletter
Receive timely and compelling market commentary from the DailyFX team
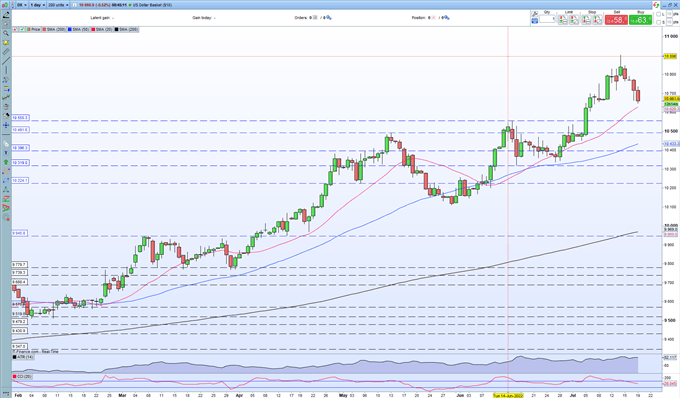
A weaker US dollar is giving gold some support, and helping to keep support at $1,700/oz. intact, as traders continue to price in the likely size and speed of US interest rate hikes in the coming months. While the recent sell-off has seen gold hit a one-week low, the greenback remains underpinned by robust fundamentals and will likely bottom out shortly.
US Dollar (DXY) Daily Price Chart - July 19, 2022
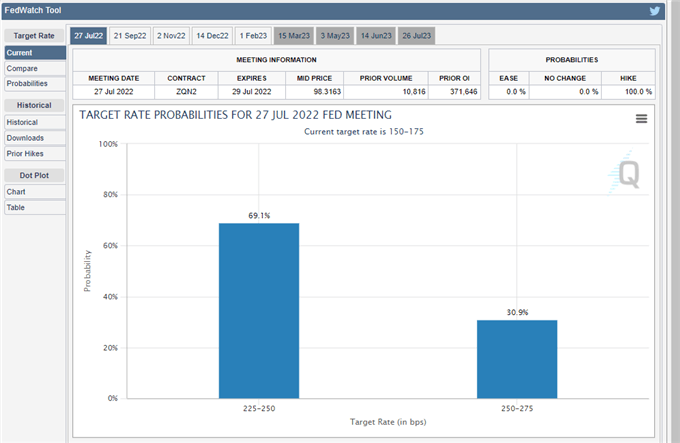
At the end of last week, the CME FedWatch Tool implied an 80%+ probability of a 100bp rate hike at next week’s meeting. Today this probability has fallen to 30% as rate bets are pared back.
Gold Price (XAU/USD) Looks Set to Test Multi-Month Support
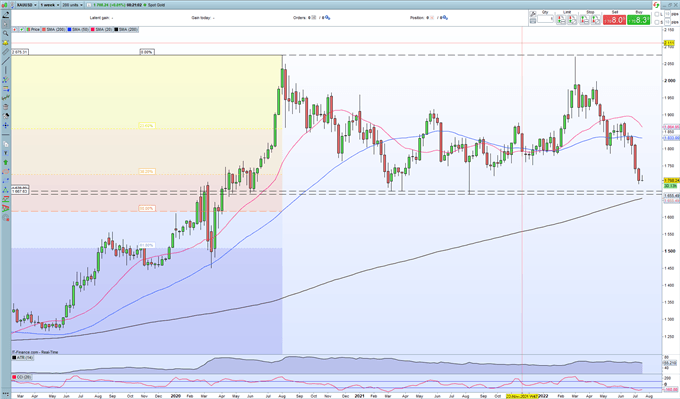
The weekly gold chart shows gold just above the recent multi-month low at $1,697/oz. while the 38.2% Fibonacci retracement level at $1,725/oz. proved solid resistance when tested yesterday. These two levels are seen holding the price of gold in the short term until a fresh driver comes into play.
Gold Weekly Price Chart – July 19, 2022
Retail trader data show 87.56% of traders are net-long with the ratio of traders long to short at 7.04 to 1. The number of traders net-long is 2.72% higher than yesterday and 5.84% higher from last week, while the number of traders net-short is 0.29% lower than yesterday and 2.36% higher from last week.
We typically take a contrarian view to crowd sentiment, and the fact traders are net-long suggests Gold prices may continue to fall. Traders are further net-long than yesterday and last week, and the combination of current sentiment and recent changes gives us a stronger Gold-bearish contrarian trading bias.
| Change in | Longs | Shorts | OI |
| Daily | 1% | -3% | -1% |
| Weekly | 2% | -8% | -2% |
What is your view on Gold – bullish or bearish?? You can let us know via the form at the end of this piece or you can contact the author via Twitter @nickcawley1.
https://www.dailyfx.com/forex/market_alert/2022/07/14/Gold-Price-XAUUSD-Looks-Set-to-Test-Multi-Month-Support.html


