


Gold Price (XAU/USD), Chart, and Analysis
- Gold is challenging support and looks set to break lower.
- Super-sized US rate hikes weigh on the precious metal.

For all market-moving data releases and events, see the DailyFX Economic Calendar.
Gold Price Forecast – Consolidation Before Breaking Lower
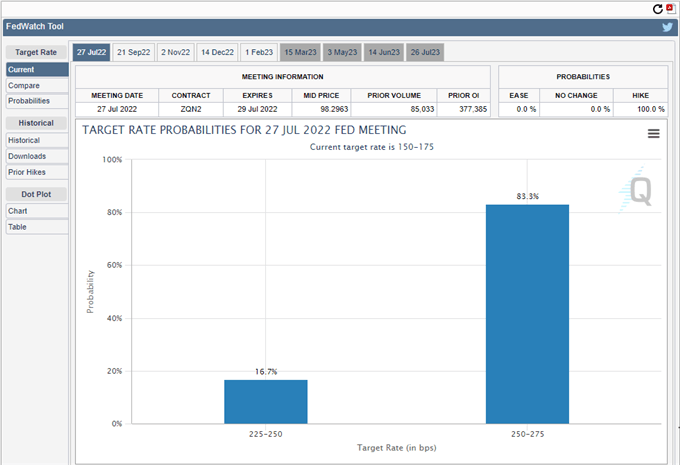
With headline inflation in the U.S. now running at a red-hot annualized pace of 9.1%, and with the Fed now seen hiking interest rates by 100 basis points at the end of the month, gold looks set to move lower in the days and weeks ahead. The CME FedWatch Tool is now showing an 80%+ probability that the Federal Reserve will hike interest rates by 100 basis points at the July 27 FOMC meeting, while an additional 75 basis points are also expected at the September 21 meeting. As interest rates continue to rise, non-interest rate-bearing gold will continue to suffer.
Trade Smarter - Sign up for the DailyFX Newsletter
Receive timely and compelling market commentary from the DailyFX team
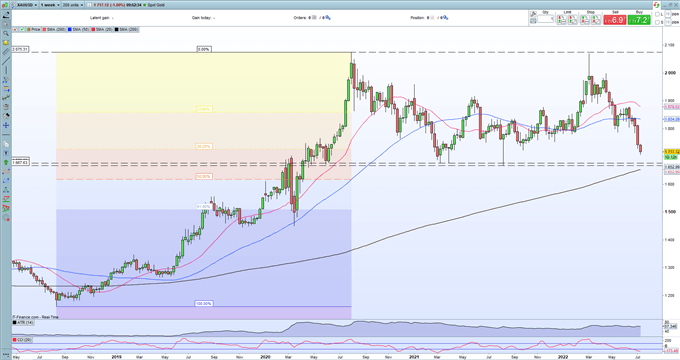
The weekly gold chart is looking weak with the precious metal likely to test an important support zone between $1,667/oz. and $1,676/oz. Before this test, gold will likely find short-term, big figure support at $1,700/oz. but this is unlikely to hold. A look at the CCI indicator shows that gold is at its most oversold level since March 2021 and this may slow any further sell-off. Initial resistance is seen between $1,721/oz. (late-September 2021 swing low) and $1,726/oz. (38.2% Fibonacci retracement) before $1,750/oz. comes into view.
Gold Weekly Price Chart – July 15, 2022
Retail trader data show 84.80% of traders are net-long with the ratio of traders long to short at 5.58 to 1. The number of traders net-long is 4.46% lower than yesterday and 4.12% lower from last week, while the number of traders net-short is 4.89% lower than yesterday and 12.69% higher from last week.
We typically take a contrarian view to crowd sentiment, and the fact traders are net-long suggests Gold prices may continue to fall. Positioning is more net-long than yesterday but less net-long from last week. The combination of current sentiment and recent changes gives us a further mixed Gold trading bias.
| Change in | Longs | Shorts | OI |
| Daily | 1% | -3% | -1% |
| Weekly | 2% | -8% | -2% |
What is your view on Gold – bullish or bearish?? You can let us know via the form at the end of this piece or you can contact the author via Twitter @nickcawley1.


