


- DAX 40:Gains as German Industrial Production Scraped Higher.
- FTSE 100:Marches Higher with PM Boris Johnson Resigning.
- DOW JONES:Edges Higher as Investors Digest FOMC Minutes.

DAX 40: Gains as German Industrial Production Scraped Higher
The Dax recorded gains in European trade as the latest data showed Germany’s industrial output scraped higher in May. This comes despite a big drop in energy output as Europe’s largest economy grapples with an increasingly severe supply crisis. The European Central Bank (ECB) released the monetary policy account minutes, in which several members want the door left open for a larger rate hike in July. “It was broadly agreed that the Governing Council should at this point be more specific about its expectations for the September meeting and, in particular, open the door to an increase in the key ECB interest rates by more than 25 basis points,” the accounts added.
Individual movers of note included Porsche, Daimler Truck Holding AG and Mercedes Benz Group AG all posting gains above 5% for the session. Green dominates the sectoral breakdown, led by consumer cyclicals and industrials with gains of 4% and 2.3% respectively.
DAX 40 Daily Chart- July 7, 2022
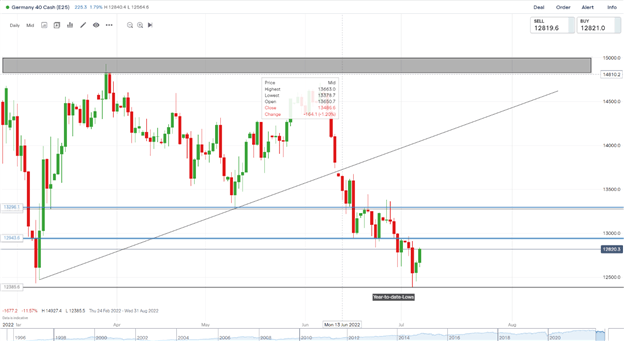
Source: IG
From a technical perspective, last week finally saw a weekly candle close below the key psychological 13000 level. We finally followed through as we created a new year-to-date low (12386). After creating a new low we have bounced, closing as a bullish inside bar candle formation on the daily timeframe signaling upside potential. We have broken resistance at 12700 and approached the key psychological 13000 level once more. Any would-be buyers would need a clear candle break and close above 13000 to confirm a move higher.
Key intraday levels that are worth watching:
Support Areas
- 12700
- 12386
- 12000
Resistance Areas
- 13000
- 13300
- 13620
Trading Strategies and Risk Management
Volatility
Recommended by Zain Vawda
FTSE 100: Marches Higher as PM Boris Johnson Resigns
The FTSE continued its march higher despite the confirmation from UK Prime Minister Boris Johnson of his resignation. UK property prices have risen at the fastest rate since 2004, according to Halifax. The country’s biggest mortgage lenders and part of Lloyds Banking Group said the market “defied any expectations of a slowdown”, with prices rising year on year in June by 13%.
In other news, UK companies have lifted their expectations for pay rises, according to a Bank of England survey.British employers’ expectations for pay growth in the coming 12 months increased to 5.1% from 4.8% in May. Analysts at Citibank are of the belief that the data significantly increases the risk of an outsized move in August. The blue-chip index posted gains of 1.5% for the session while the sectoral breakdown is predominantly green as basic materials and energy lead the way.
Introduction to Technical Analysis
Support and Resistance
Recommended by Zain Vawda
FTSE 100 Daily Chart - July7, 2022
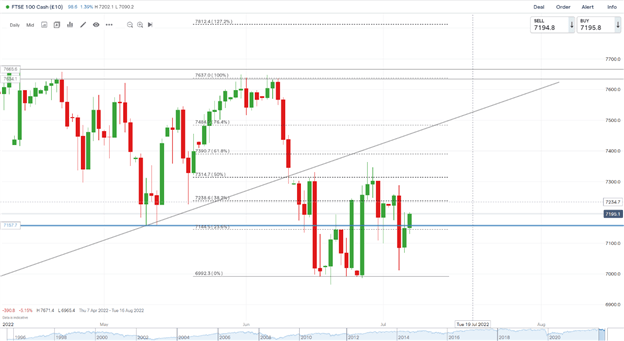
Source:IG
The FTSE closed last week as a doji candlestick signaling indecision may be ahead. Yesterday we had an inside bar bullish candle close on the daily signaling the potential for upside. As we push higher in European trade, the 38.2% fib level should provide resistance. We have been ranging between the 0% and 50% fib level since the 10th of June which might be worth remembering if we do reach that level. We do need a break and candle close above to confirm further upside potential.
Trading Ranges with Fibonacci Retracements
Key intraday levels that are worth watching:
Support Areas
- 7127
- 7012
- 6870
Resistance Areas
- 7240
- 7314
- 7400
| Change in | Longs | Shorts | OI |
| Daily | -30% | 25% | 2% |
| Weekly | -44% | 44% | 0% |
DOW JONES:Edges Higher as Investors Digest FOMC Minutes
The Dow edged higher in premarket trade after the US Federal Reserve affirmed its commitment to tackling soaring inflation. While investors are keen for the central bank to act to control inflation, which remains at levels not seen since the 1980s, they are also warily trying to assess the impact of aggressive rate hikes on the country’s growth profile amid worries about a potential recession.
The US labor market saw initial unemployment claims increaseby 4,000 to 235,000 in the week ended July 2, Labor Department data showed Thursday.The rise in claims underscores some moderation in what’s been an extremely tight labor market, as applications hold near the highest level since January.
On the calendar front, we have speeches by US Federal Reserve Members James Bullard and Chris Waller later in the day.

Customize and filter live economic data via our DailyFX economic calendar
DOW JONES Daily Chart – July 7, 2022
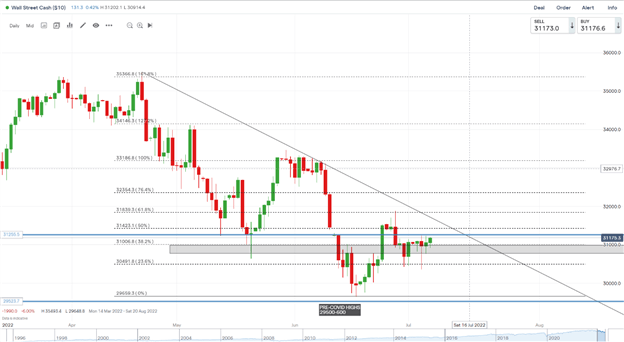
Source: IG
From a technical perspective, Yesterday saw price flip-flop from losses to gains before closing around 70 points higher just above our support area (Grey Box) and the 38.2% fib level. We are currently pushing higher as we approach our resistance area at 31255 with a break above potentially bringing the trendline back into play. Given the choppy price action recently we might struggle to break above the trendline, it could offer a solid sell-the-rally opportunity for would-be sellers.
Key intraday levels that are worth watching:
Support Areas
- 31000
- 30500
- 30000
Resistance Areas
- 31255
- 31750
- 32354
| Change in | Longs | Shorts | OI |
| Daily | -18% | 18% | 7% |
| Weekly | -19% | 14% | 4% |
Written by: Zain Vawda, Market Writer for DailyFX.com
Contact and follow Zain on Twitter: @zvawda
https://www.dailyfx.com/education/fibonacci/trading-ranges.html


