


- DAX 40:Gains as Retail Sales and German Factory Orders Surprise.
- FTSE 100:Pushes Higher Despite Political Turmoil.
- DOW JONES:Flat as Markets Await FOMC Minutes for Direction.

DAX 40: Gains as Retail Sales and German Factory Orders Surprise.
The Dax pushed higher in European trade on the back of positive data. German factory orders unexpectedly rose in May, climbing for the first time in four months. Demand increased 0.1% with the gain driven by major orders and excluding those, orders fell 0.9%, according to a statement from the German statistics office on Wednesday.
Eurozone retail sales data surprised beating estimates, yet still showed signs of a slowdown in consumer spending. Prospects for Europe’s largest economy have darkened as Russia cut back on gas deliveries, raising the risk of shortages in the coming winter.
On the corporate front, BMW (BMWG) will be in the spotlight with the German auto giant set to publish its second-quarter sales. The sectoral breakdown is dominated by green as technology and real estate lead the way with gains of 2.35% and 2.12% respectively.
DAX 40 Daily Chart - July 6, 2022
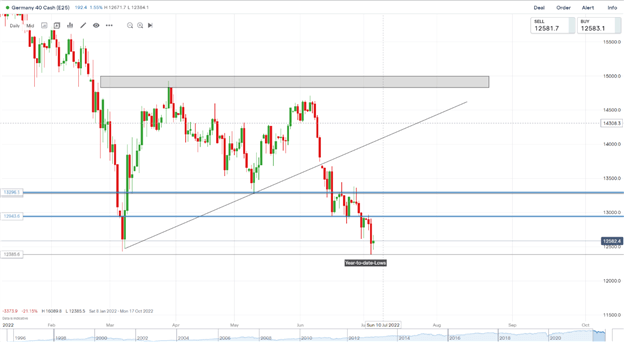
Source: IG
From a technical perspective, last week finally saw a weekly candle close below the key psychological 13000 level. We finally followed through yesterday as we smashed through previous year-to-date lows (12425). After creating a new low we bounced and gained approximately 280 points, yet price remains pressured to the downside. Having created a new low, should we push higher 12700 may present an opportunity for would be sellers to get involved.
Key intraday levels that are worth watching:
Support Areas
- 12385
- 12031
- 11550
Resistance Areas
- 12700
- 12945
- 13220
Trading Strategies and Risk Management
Volatility
Recommended by Zain Vawda
FTSE 100: Pushes Higher Despite Political Turmoil
The FTSE opened in the green this morning pushing higher despite the political turmoil in the UK. The blue-chip index posted gains of around 2.2% for the session. Political turmoil as Sajid Javid and Rishi Sunak have both quit as ministers in a devastating blow to Boris Johnson. Johnson vowed to fight back however, as Steve Barclay and Nadhim Zahawi were installed as Health Secretary and Chancellor of the Exchequer while several junior ministers resigned as well. A historic meeting beckons as the 1922 Committee of Tory backbenchers will meet at 5pm to discuss a rule change to allow a confidence vote to take place at a meeting of the executive on Wednesday afternoon. Johnson is protected by the current rules, which grant a year’s immunity after he won a confidence vote a month ago.
S&P Global data shows housebuilding activity slowed in June reading at 49.3, the weakest pace for nine months. In other news, the Bank of England (BOE) Chief Economist Huw Pill said the BOE’s latest guidance showed a willingness to accelerate their hiking cycle if necessary.
The sectoral breakdown is green with industrials, basic materials, consumer and non-consumer cyclicals and real estate all posting gains above 2%.
Introduction to Technical Analysis
Support and Resistance
Recommended by Zain Vawda
FTSE 100 Daily Charts - July 6, 2022
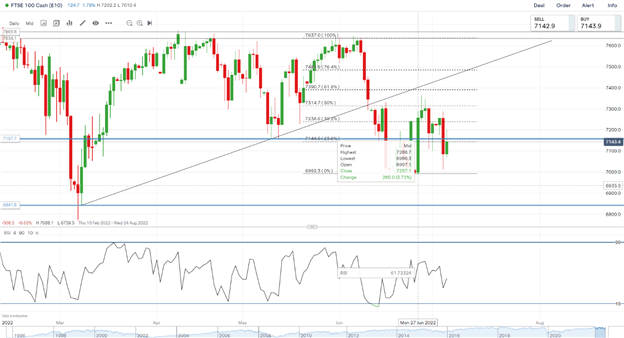
Source:IG
The FTSE closed last week as a doji candlestick signaling indecision may be ahead. Yesterday we bounced off the key psychological area 7000 yesterday, rallying this morning into our resistance area at 7197(mentioned yesterday). We have since retreated below the 23.6% fib level and still remain rangebound above our psychological level and upside capped by resistance at 7197. Without any notable breakout, range trading remains in play.
Trading Ranges with Fibonacci Retracements
Key intraday levels that are worth watching:
Support Areas
- 7000
- 6870
- 6720
Resistance Areas
- 7197
- 7284
- 7400
| Change in | Longs | Shorts | OI |
| Daily | -30% | 25% | 2% |
| Weekly | -44% | 44% | 0% |
DOW JONES:Flat as Markets Await FOMC Minutes for Direction
The Dow traded lower in premarket before recovering as we approach the US market open.
While bargain hunters chasing technology stocks boosted US equity gauges on Tuesday, it only helped to mask a deepening slump in stocks linked to economic activity, such as energy, commodity and industrial names. The odds of a US recession in the next year are now 38%, according to the latest forecasts from Bloomberg Economics.Bond traders are penciling in a policy turnaround by the Federal Reserve, with current hawkishness giving way to interest-rate cuts in the middle of 2023.
On the calendar front, we have a slew of US data with ISM non-manufacturing data and the highly anticipated FOMC minutes, which are expected to provide guidance on the US Federal Reserve’s policy outlook moving forward.

Customize and filter live economic data via our DailyFX economic calendar
DOW JONES Daily Chart – July 6, 2022
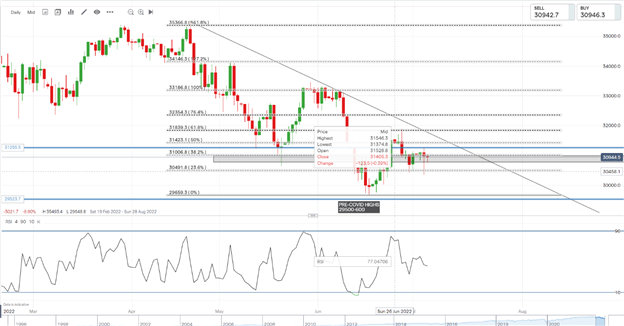
Source: IG
From a technical perspective, Yesterday saw a decline before the price bounced off the 23.6% fib level around 30500 and close just below the psychological 31000 round number, forming a hanging man candlestick formation. We are currently resting in a support zone (grey box on the chart), however any upside move would need to take out resistance at the 31250 before a retest or trendline break becomes a possibility.
Key intraday levels that are worth watching:
Support Areas
- 30491
- 30000
- 29550
Resistance Areas
- 31255
- 31800
- 32354
| Change in | Longs | Shorts | OI |
| Daily | -18% | 18% | 7% |
| Weekly | -19% | 14% | 4% |
Written by: Zain Vawda, Market Writer for DailyFX.com
Contact and follow Zain on Twitter: @zvawda


